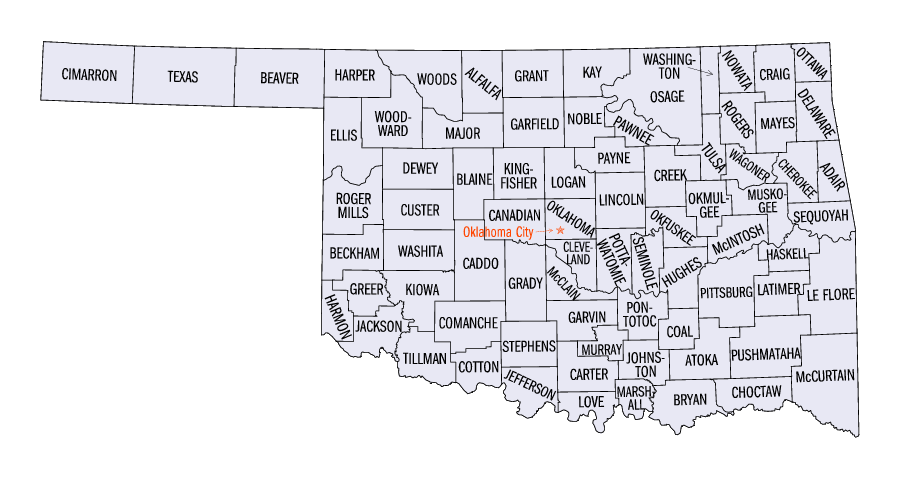
Oklahoma
Unless otherwise noted, the following information comes from the Fluoridation Census 1992 published by the Centers for Disease Control and Prevention, Division of Oral Health, in 1993.
Information from: Fluoridation Census 1992. Published 1993 by the Centers for Disease Control & Prevention, Division of Oral Health.
• It is not known if the water systems listed below are all still active
• The state Water System ID is the same as EPA’s preceded with the state’s initial. For example, Oklahoma would be OK0000000

State |
Water Systems |
County |
EPA ID No. |
Population |
Natural Level of Fluoride (ppm) |
|
A Milligram per Liter (mg/L) is the same as Part Per Million (ppm) Not all water fluoride levels are included in the Fluoridation Census 1992 |
|||||
0.7 – 0.9 ppm |
|||||
| Oklahoma | Kingston | Marshall | 2004501 | 1,440 | 0.7 |
| Oklahoma | Laverne | Harper | 2003002 | 1,420 | 0.7 |
| Oklahoma | Loco RWD 4 | Stephens | 2006904 | 900 | 0.7 |
| Oklahoma | Roff City | Pontotoc | 2006206 | 830 | 0.7 |
| Oklahoma | Rural Water Dixtrict 2 | Ottawa | 2005804 | 700 | 0.7 |
| Oklahoma | Prague | Lincoln | 2004101 | 2,300 | 0.8 |
| Oklahoma | Edmond | Oklahoma | 2005505 | 47,000 | 0.9 |
| Oklahoma | Hooker | Texas | 2007006 | 1,788 | 0.9 |
| Oklahoma | Jet | Alfalfa | 2000211 | 275 | 0.9 |
| Oklahoma | Kansas PWA | Delaware | 2002135 | 500 | 0.9 |
| Oklahoma | Southwest LIvestock Research | Canadian | 2000903 | 75 | 0.9 |
| Oklahoma | Wilson | Carter | 201001 | 1,750 | 0.9 |
1.0 – 1.4 ppm |
|||||
| Oklahoma | Bokchito | Bryan | 2000704 | 633 | 1.0 |
| Oklahoma | Oakhill Commercial Water | Delaware | 2002143 | 100 | 1.0 |
| Oklahoma | Tipton | Tillman | 2007101 | 1,170 | 1.0 |
| Oklahoma | B & B Water | Cimarron | 2001301 | 300 | 1.2 |
| Oklahoma | Optima | Texas | 2007001 | 72 | 1.2 |
| Oklahoma | Oklahoma State Reformatory | Greer | 2002803 | 1,200 | 1.3 |
| Oklahoma | Bennington RWD | Bryan | 2000705 | 317 | 1.3 |
| Oklahoma | Boise City | Cimarron | 2001303 | 1,800 | 1.3 |
| Oklahoma | Hickory Meadows | Delaware | 2002146 | 50 | 1.3 |
| Oklahoma | Afton | Ottawa | 1021696 | 1,500 | 1.4 |
| Oklahoma | Country Club Estates | Cleveland | 2001448 | 75 | 1.4 |
| Oklahoma | Devol | Cotton | 2001701 | 186 | 1.4 |
| Oklahoma | Ringling | Jefferson | 2003404 | 1,700 | 1.4 |
| Oklahoma | West Carter RWD | Carter | 2001003 | 2,000 | 1.4 |
1.5 – 1.9 ppm |
|||||
| Oklahoma | Adams RWD 1 | Texas | 2007010 | 135 | 1.5 |
| Oklahoma | Monkey Island Airport Resort | Delaware | 2002167 | 50 | 1.5 |
| Oklahoma | Ratcliff City | Carter | 2001002 | 350 | 1.5 |
| Oklahoma | Beaver RWD 1 (Turpin) | Beaver | 2000402 | 490 | 1.6 |
| Oklahoma | Calumet | Canadian | 2000904 | 600 | 1.6 |
| Oklahoma | Shangri-La | Delaware | 2002136 | 175 | 1.6 |
| Oklahoma | Texhoma | Texas | 2007009 | 800 | 1.6 |
| Oklahoma | Northwest Central Pipeline | Texas | 2007012 | 125 | 1.7 |
| Oklahoma | Peels MHP | Seminole | 2006706 | 70 | 1.7 |
| Oklahoma | Peels MHP | Seminole | 2006706 | 70 | 1.7 |
| Oklahoma | Sunset Hills Subdivision | Delaware | 2002133 | 45 | 1.7 |
| Oklahoma | Texas Co RWD #2 | Texas | 2007004 | 243 | 1.9 |
| Oklahoma | Guyman | Texas | 2007003 | 8,492 | 1.9 |
2.0 – 12.0 ppm |
|||||
| Oklahoma | Goodwell | Texas | 2007005 | 1,186 | 2.0 |
| Oklahoma | Lakemont Shores | Delaware | 2002170 | 90 | 2.3 |
| Oklahoma | Wellston | Lincoln | 2004140 | 900 | 2.3 |
| Oklahoma | Panhandle St University | Texas | 2007001 | 1,200 | 2.5 |
| Oklahoma | Bowlegs Lima Water District | Seminole | 2006701 | 1,850 | 3.6 |
| Oklahoma | Maud | Seminole | 2006302 | 1,251 | 3.7 |
| Oklahoma | Deer Creek Water Corp | Oklahoma | 2000504 | 1,900 | 3.8 |
| Oklahoma | Bluejacket | Craig | 260 | 4.4 | |
| Oklahoma | Bowlegs Water Works | Seminole | 2006707 | 150 | 4.6 |
| Oklahoma | Cache | Comanche | 2001607 | 1,800 | 5.4 |
| Oklahoma | Miami | Otawa | 2005813 | 15,000 | 5.4 |
| Oklahoma | Delhi | Beckham | 2000507 | 60 | 7.0 |
| Oklahoma | Indiahoma | Comanche | 2001609 | 425 | 10.2 |
| Oklahoma | Geronimo | Comanche | 2001611 | 1,200 | 12.0 |
Notes:
Please email Fluoride Action Network if you have information to share on levels of naturally occurring fluoride in U.S. drinking water or other bodies of water.
Percentage of State Population served by Public Water Systems that Receive Fluoridated Water |
|||||
| State | 2014 | 2012 | 2006 | 2000 | 1992 |
| Oklahoma | 62.5% | 70.1% | 73.5% | 74.6% |
58.0% |
