Timeline for Community Water Fluoridation
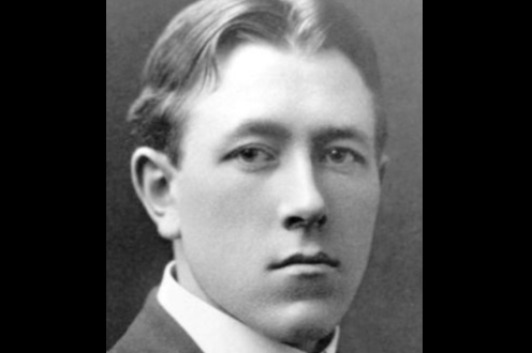
1901
Dentists in the United States and Italy separately observe lower rates of dental decay in populations
with distinctively stained teeth. Dr. Frederick S. McKay of Colorado Springs, Colorado, notes that
many residents have what locals call “Colorado brown stain” and devotes his career to investigating
the phenomenon he labels “mottled enamel.”
1912
The Marine Hospital Service, formerly dedicated to caring for ill and disabled mariners, becomes
responsible for improving the health of the general population and is renamed as the US Public
Health Service (USPHS) which later includes the National Institute of Health (NIH) and the Centers
for Disease Control and Prevention (CDC).
1914
US drinking water standards are enacted. Even though the federal standards only apply to
interstate carriers (mainly railways), many state regulators adopt them too.
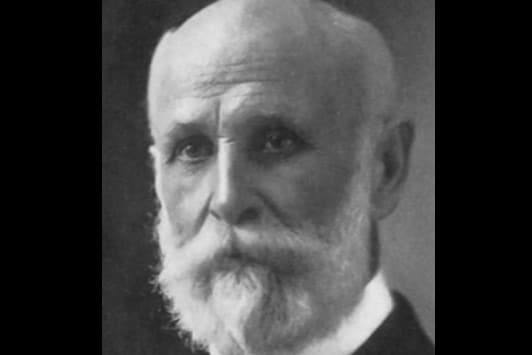
1915
G.V. Black, dean of Northwestern University Dental School, joins McKay in Colorado to study
dental mottling. McKay grows more and more certain that something in the drinking water
is the cause. However, analysis of water samples from stricken communities in half a dozen
states reveal nothing out of the ordinary. McKay’s and Black’s collaboration spans decades,
and they jointly publish five seminal papers on dental mottling.
1916
The first of McKay’s and Black’s papers reveals a paradox at the heart of their investigation:
“Contrary to what might be expected [mottling] does not seem to increase the susceptibility
of the teeth to decay.
1925
A dentist in Essex, England, determines that children living where mottled enamel is most
common in the UK tend to have much less dental decay than other children. Meanwhile,
McKay convinces the residents of an Ohio town where mottling is widespread to spend
$35,000 to switch to a new water supply.

1927
Throughout the 1920s, Dr. F.L. Robertson of Bauxite, Arkansas, observes an unusual number of
cases of mottled enamel among local children born after 1909, when their community began
drawing water from a new well. Aluminum in the abundant bauxite ore for which the town is
named is wrongly assumed to be causing the mottling, and the well is abandoned in 1927.
Coincidentally, while on a 1927 trip to Italy, McKay learns that children in a Neapolitan suburb
who were born after their community’s switch to a new water source do not share their parents’
dental staining, a local trait known since Roman times.
1928
McKay learns of the situation in Bauxite and requests water samples from the town’s wells.
McKay’s analysis again proves inconclusive.
1930
H.V. Churchill, a chemist with Aluminum Company of America (now Alcoa), which owns the
town of Bauxite and its mines, uses new technology to analyze water from the abandoned well
and finds that it contains a concentration of fluoride many times higher than normal. McKay
sends water to Churchill for analysis. Churchill finds that McKay’s samples also have extremely
high concentrations of fluoride.
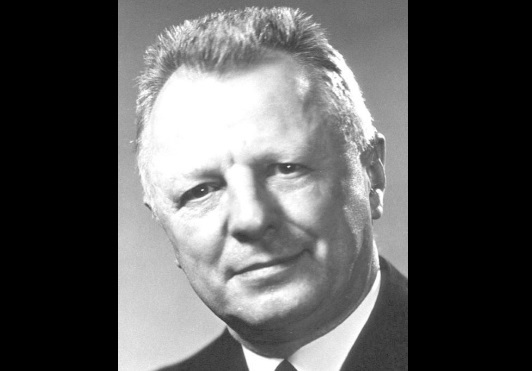
1931
Dr. H. Trendley Dean, USPHS officer and founder of the Dental Hygiene Unit at the recently
established NIH, determines that mottled enamel is caused by too much fluoride intake.
He renames the condition “dental fluorosis.” Dean begins a long-running series of epidemiologic
studies exploring the relationship between fluoride intake, dental fluorosis, and tooth decay.
1932
McKay returns to Oakley, Ohio, which switched to a new water supply at his urging in 1925.
He finds that the children born since then have no dental mottling.
1934
Dean publishes detailed criteria for diagnosing dental fluorosis.
1935
Dean declares fluorosis “an acute and urgent public health problem.”
1936
Dean concludes that people who drink water with a fluoride concentration of 1.0 ppm or lower have extremely low risk of developing even cosmetic fluorosis. He then tries to determine whether drinking water with fluoride at levels too low to cause fluorosis might provide resistance to cavities, similar to that observed in visibly mottled teeth.
1938
Analyzing data collected by others on rates of fluorosis and dental decay among children in 26 states, Dean notes “a strong inverse relation” between the conditions.
1939
Dr. Gerald J. Cox and a team of scientists from the Mellon Institute at the University of Pittsburgh publish a paper proposing the controlled addition of fluoride to drinking water to prevent tooth decay.
1942
21 Cities Study: Dean publishes the findings of an NIH study of 7,200 children aged 12 to 14 from 21 cities in Colorado, Illinois, Indiana, and Ohio. Children tended to have fewer cavities and less severe decay in cities with more fluoride in the community water supply. This effect plateaued at concentrations greater than 1.0 ppm. Building on his 1936 findings, Dean concludes that 1.0 ppm fluoride in drinking water reduces rates of tooth decay with negligible risk of fluorosis. Dean also updates his diagnostic criteria for dental fluorosis. His revised fluorosis index remains in clinical use to this day.

Feb 1943
Reader’s Digest reprints “The Town Without a Toothache,” an article from the December 19, 1942, issue of Collier’s magazine touting the cavity-preventing power of naturally fluoridated water in Hereford, Texas. Parts of the article also appear in newspapers nationwide.
Aug 2, 1944
Grand Rapids City Commission votes to approve a pilot fluoridation project.
Oct 1944
An editorial published in the Journal of the American Dental Association (JADA) warns against rushing to fluoridate drinking water.
Dec 1944
JADA walks back its criticism of fluoridation in a follow-up editorial, but it reiterates the need for more research before fluoridation can be considered an acceptable public health intervention.
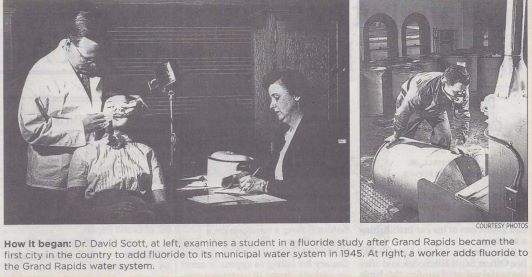
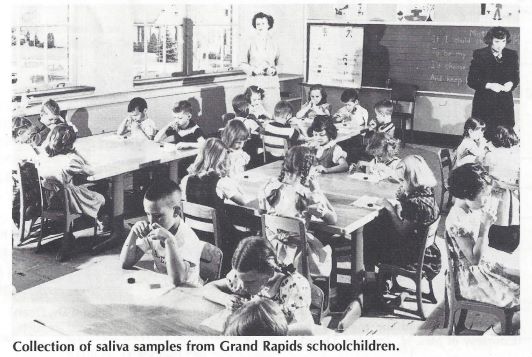
1945
Fluoridation trials: A planned 15-year trial of community water fluoridation is launched in four cities. Each fluoridating city is paired with a “control,” a nearby city of similar size and demographic makeup, with a low-fluoride water source similar to that of the trial city. Fluoridating Grand Rapids, Michigan, is paired with neighboring Muskegon; Newburgh, New York, with Kingston; Evanston, with Oak Park; and—in Canada—Brantford, Ontario, with nearby Sarnia. Two other cities with water having a natural fluoride content near 1.0 ppm serve as fluoridated controls. The study included these two cities to see whether fluoride-adjusted water performs differently than naturally fluoridated water. Aurora, Illinois, is the naturally fluoridated control for the Grand Rapids–Muskegon trial, and Stratford, Ontario for Brantford–Sarnia. Schoolchildren in all participating cities receive annual dental exams throughout the trial. By year’s end, 232,000 Americans are receiving fluoridated tap water from their community water system.
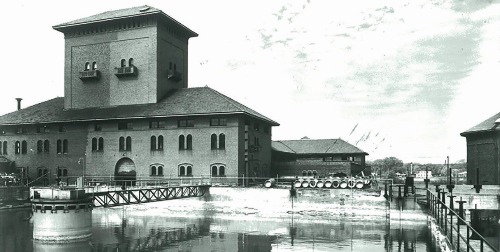
Jan 25, 1945
Grand Rapids, Michigan, becomes the first city to fluoridate when engineers at the Monroe Avenue Water Filtration Plant begin adding a carefully controlled amount of sodium fluoride to the city’s water supply at 4:00 p.m.
1946
The Evanston–Oak Park fluoridation trial begins. It is more intricate than the other US trials. A few smaller, institutional-scale fluoridation projects unrelated to NIH’s grand long-term trials also are launched. This raises the total number of Americans receiving fluoridated tap water to 328,000 by the end of the year.
1948
577,683 Americans receive fluoridated tap water.
1949
The first children to drink fluoridated water since infancy begin reaching school age. Dental examiners in Grand Rapids, Newburgh, and Brantford report a sharply lower number of cavities among the children starting school in 1949. Cities and small towns across Michigan, Texas, and Wisconsin begin fluoridation programs of their own. The number of Americans receiving fluoridated tap water nearly doubles in just 1 year, with the total number climbing to just under 1 million.
1950
The Grand Rapids–Muskegon and Newburgh–Kingston trials reach the 5-year mark and undergo formal review, which determines that “controlled fluoridation displayed the same effects as natural fluoridation.”
June 1950
The American Dental Association, Association of State and Territorial Dental Directors, and USPHS all issue statements endorsing community water fluoridation. The Surgeon General declares that any community wishing to fluoridate its water supply should be “strongly encouraged” to proceed. By year’s end, another half-million Americans are receiving fluoridated tap water, raising the total number to 1.5 million.
July 1951
Muskegon withdraws from the fluoridation trial and begins fluoridating its water. With the loss of its control city, the Grand Rapids trial is technically finished. However, schoolchildren in both cities continue receiving annual dental exams for another decade, and by 1960 rates of tooth decay are roughly equal among children in Muskegon and Grand Rapids. The total number of Americans receiving fluoridated tap water leaps to 4.85 million in 1951, a threefold increase over the previous year.
1952
The total number of Americans receiving fluoridated tap water nearly triples again, reaching 13.3 million. With an increase of 8.4 million people served, 1952 marks the third-largest expansion of community water fluoridation in history.
1954
The number of Americans receiving fluoridated tap water passes 20 million.
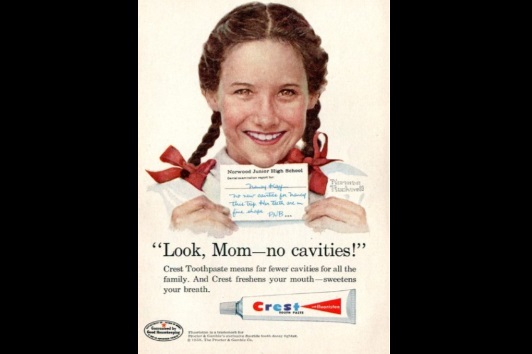
1956
Crest, the world’s first fluoride toothpaste, is released nationally. Fluoride toothpastes become very common in developed countries by the mid-1960s, and many other fluoridated oral care products are created over the next few decades.
1962
Updated federal drinking water standards address fluoride for the first time, setting recommended and maximum allowable levels in drinking water. The standards use a sliding scale to adjust levels for increased water consumption—and therefore, fluoride—in warmer weather. The optimal level varies from 0.7 ppm to 1.2 ppm, depending on the local climate.
1963
A US Public Health Service fluoridation team publishes Manual of Water Fluoridation Practice, the first fluoride engineering handbook.
1965
Another 13.5 million Americans begin receiving fluoridated tap water, marking the largest annual expansion of community water fluoridation ever. Nearly 8 million people gain access to fluoridated drinking water in New York City alone.
1967
Another 9.5 million Americans begin receiving fluoridated tap water, marking community water fluoridation’s second-largest annual expansion.
1969
The US population passes 200 million, and 43.7% of Americans receive fluoridated tap water. The US Public Health Service conducts a survey of more than 1,000 US community water supplies and finds state oversight of public water systems lax and water quality uneven.
1970
The US Environmental Protection Agency (EPA) is created, combining federal pollution control and environmental oversight responsibilities into a single agency with regulatory authority.
1972
The Clean Water Act gives EPA responsibility for developing mandatory standards to control water pollution and authority to enforce those standards.
1974
The Safe Drinking Water Act (SDWA) gives EPA jurisdiction over drinking water quality and makes EPA standards legally binding for all US public water supplies. SDWA replaces the USPHS goal of “healthy water” with a goal of toxicologically “safe water,” as determined by EPA-set thresholds for contaminants. SDWA also stipulates that EPA cannot mandate the addition of any substance to drinking water for health benefits and can require only additives that are needed to achieve safe water requirements. The Safe Drinking Water Act thus redefines drinking water fluoridation as a state, not federal, responsibility.
1975
Over 100 million Americans receive fluoridated tap water.
1978
The Surgeon General transfers the National Fluoridation Program to the Centers for Disease Control (CDC), where responsibility for providing guidance and technical support to state and territorial fluoridation programs remains to this day.
1980
Half of the total US population receives fluoridated tap water.
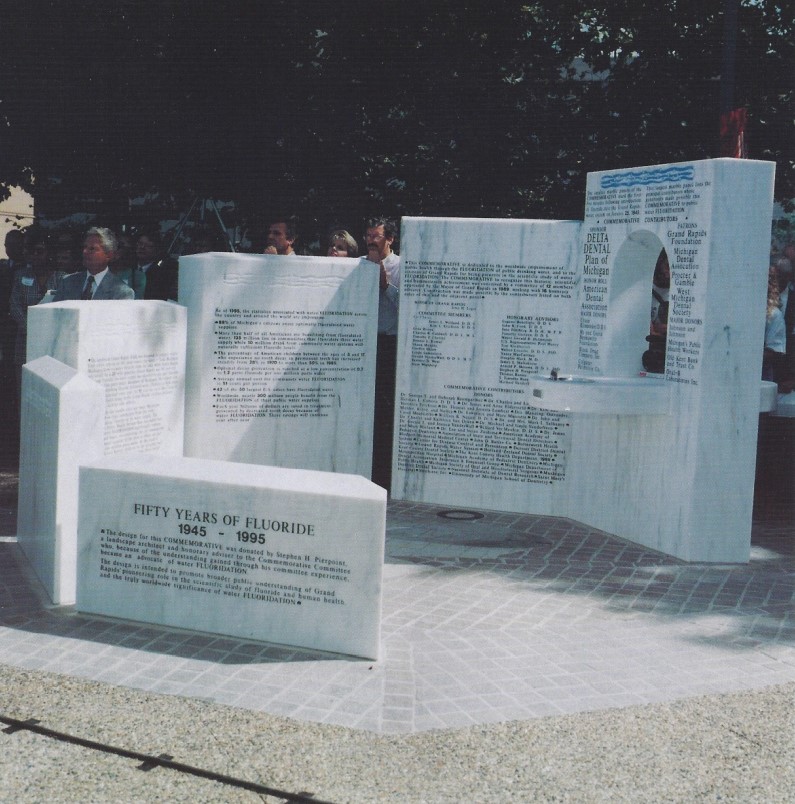
1995
Grand Rapids celebrates “Fifty Years of Fluoridation” with a symposium and a massive marble monument. The monument (which includes a drinking water fountain) was moved because of new construction in 2007 and now resides on the Delta Dental corporate campus in Okemos, Michigan.
2002
The former Monroe Avenue Water Filtration Plant in Grand Rapids, where the 1945 fluoridation trials began, is added to the National Register of Historic Places.
2008
The US population passes 300 million, and 64.3% of the population receives fluoridated tap water.
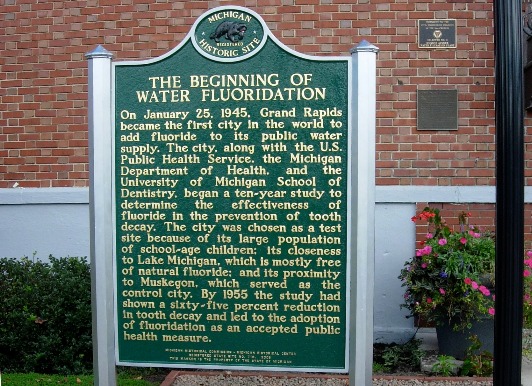
2010
Over 200 million Americans (66.2%) receive fluoridated tap water. A Michigan Historical Marker recognizing “the beginning of water fluoridation” is installed outside the former Monroe Avenue Water Filtration Plant in Grand Rapids.
2012
Three-quarters of Americans (74.6%) served by a public water system receive fluoridated water, and 67.1% of the US population receives fluoridated tap water.
2015
Recommendations for optimal fluoride concentration in drinking water are simplified. Citing the widespread availability of fluoride in drinking water and oral care products, trends in the prevalence and severity of dental fluorosis, and current evidence on fluid intake of children living in varied climates, the USPHS recommends that, “Community water systems use a single concentration of 0.7 mg/L of fluoride in drinking water to maintain cavity prevention benefits and reduce the risk of dental fluorosis.” Public water systems across the country begin fluoridating at 0.7 ppm.
2020
Aiming to build on 75 years of proven safety and effectiveness, the Department of Health and Human Services updates its Healthy People 2030 objectives with a goal of increasing “the proportion of people whose water systems have the recommended amount of fluoride” to 77.1%.
- National Institutes of Health/National Institute of Dental and Craniofacial Research: The Story of Fluoridationexternal icon
- Michigan Dental Association: 75 Years of Water Fluoridationexternal icon
Page last reviewed: April 28, 2021