Editor’s note: Learn more about the impact of fluoride on mild steel in this Materials Performance quarterly special feature, “The Science Behind It.” After you read the MP article about the study on corrosion effects of fluoride-containing brackish water in steel mills, explore the science behind the corrosion problem, which is presented in several related CORROSION articles listed at the end of the article.
__________________________________________________
In their pursuit of zero effluent discharge, industrial plants are reducing fresh water intake and limiting the volume of water released back into the environment. Because of this and the cascading reuse of water, industry is often forced to utilize inferior water quality for lower risk applications. The utilization of substandard water as makeup water to open recirculating cooling water systems can often render these complex water systems susceptible to increased fouling and corrosion. This can severely hamper production, threaten both plant and process integrity, and ultimately add to the company’s cost and risk of doing business.
Waterborne constituents responsible for fouling or corrosion may be either microbiological or chemical in nature. When an available water source is considered brackish, as it was for a southern African steel mill, the water conductivities range from 2,500 to as high as 5,000 µS/cm1 with the principle anions being chloride (200 to 800 mg/L), sulfate (400 to 1,000 mg/L), and varying levels of fluoride (2 to 100 mg/L). In steel mills, fluorspar (the mineral form of calcium fluoride [CaF2]) has been used for centuries as a flux for ores and is the primary reason for the high levels of fluoride in their water systems.
Early work done to better understand and predict the corrosivity of water to mild steel extends back to Tillmans and Heublein2 and Langelier.3 Some of the indexes that have gained acceptance in the chemical industry worldwide, including those inadvertently used to predict corrosion, are the Langelier saturation index (LSI),3 Ryznar stability index (RSI),4 Puckorius or practical scaling index,5 Larson-Skold index or ratio,6 and the more recent eight-variable empirical model constructed by Pisigan and Singley.7 The former indexes were designed primarily for the drinking water industry and were mostly indicative of the tendency of a surface water to precipitate calcium carbonate (CaCO3) rather than predict the absolute corrosivity of specific waters. It has been stated that the LSI has no correlation with corrosion rate;8 and it was suggested that use of the LSI for corrosion prediction should be abandoned based on empirical evidence.9 The same sentiment applies to the RSI and the various “corrosion prediction indexes” that emerged during this period, which were also grounded on the same principle.
A key parameter relevant to the steel mill’s brackish water is the fluoride concentration. Although various authors have studied the corrosivity of fluoride and there is ample evidence of its impact on mild steel,10-12 additional research was necessary to be able to predict the corrosivity of fluoride in fresh and brackish water. The purpose of this study was to develop mathematical models of the impact of fluoride on mild steel in brackish water at temperatures typical of industrial cooling water.
Experimental Procedure
Field Work
Before starting the laboratory evaluations, it was necessary to collate and analyze on-site laboratory data from the steel manufacturer’s two open recirculating cooling water systems. The data were used to establish the operating ranges of the key water chemistry parameters being monitored, and determine the low-carbon mild steel (C1010) coupon corrosion rates. The coupons were similar to piping metallurgy API 5L Gr B and SABS 719 Gr A. ASTM standard D2688-9013 was followed in terms of the design, installation, and operation of the bypass specimen test rack installed on the hot water return to the cooling towers. The fluid velocity was maintained at ~1.5 m/s and the coupons were exposed for 30 days. The coupon cleaning method followed ASTM standard G1-90.14
Two licensed software programs were used during the evaluations to predict the various saturation and engineering indexes, and compile statistics. The data were collated from March 3, 2009 to March 25, 2011. A detailed list of the equipment—as well as a detailed list of the analytical equipment, laboratory reagents, and consumables—are outlined in Reference 1.
Laboratory Work
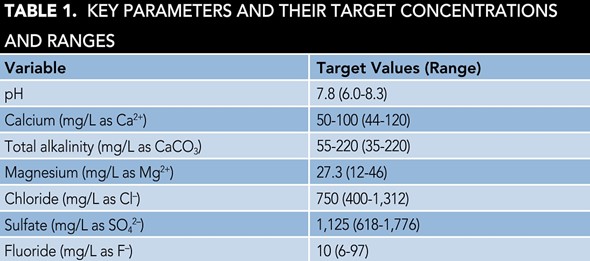
Figure 1 shows the corrosion test setup and Table 1 lists the key water parameters. The limiting condition for the applicability of this study is that the water must have a quality image as defined in Table 1.

The laboratory corrosion tests were performed in two rounds. In the initial round, the tests were performed per classical design by varying a single parameter at a time while maintaining the other parameters as constants. In the second round of tests, a fractional factorial design approach was adopted and statistical software was used to perform the exercise. The parameter values were all varied for each run and the combined effect of varying all the parameters provided a wider range of water chemistries than the classical design.
In both rounds, C1010 corrosion coupons were subjected to synthetic test solutions (4,000 mL). The tests were all conducted at 45 °C over a period of 72 h. The contents of the vessel were stirred at 100 to 110 rpm to produce a linear velocity of 1.5 m/s at the coupon surface. In the classical design round, each test contained two coupons and was performed in triplicate. In the factorial design experiment, each vessel contained three corrosion coupons.
The coupons were removed, cleaned, and weighed, and the corrosion rates calculated based on their weight loss in accordance with ASTM methods G1-90 and G31-72.15 The corrosivities of the corrosion test solutions were determined by using the direct weight technique on the C1010 corrosion coupons.
At the start of the test, 1 L of each test solution was removed and submitted for laboratory analyses. Upon ending the 72-h corrosion tests, additional test solution samples were submitted for the same analyses.
Results
Field Results
Figure 2 demonstrates moderately positive correlations between the corrosion rates of the two systems.

Although cooling water system one (CWS 1) and cooling water system two (CWS 2) received the same brackish makeup water, there were significant differences in their operating conditions and chemical treatment, namely the system volumes; operating temperatures; cycles-of-concentration; side-stream sand filter efficiencies; and, most importantly, the oil removal rates.Due to numerous unaccounted-for factors that could have potentially affected the coupon corrosion rates, it was virtually impossible to arrive at any statistically significant correlations between each individually monitored water chemistry parameter and the coupon corrosion data. This was evident for both cooling water systems over a period of 20 months. Many of the literature-derived indexes mentioned previously were also applied to the two systems, but the results lacked meaningful, statistically significant correlations.
Since this exercise proved largely futile at identifying the key factors responsible for the mild steel corrosion, it was necessary to conduct a laboratory investigation of the possible combined effects and interdependency of the various factors.
Laboratory Results
Extensive laboratory data captured from classical and factorial design experiments performed at 45 °C were analyzed using the statistical software, and the results were used to derive a multiple regression for the average corrosion rate (mmpa) (with an R2 of 81%1) using Equation (1):

where chloride (Cl) and fluoride (F) are measured as mg/L, and total alkalinity (M alk) is measured as mg/L of CaCO3.
A comparison of this brackish water model (BWM) with the previously evaluated indexes for CWS 1 cooling water revealed significantly improved accuracy of the new model over the four indexes.

Figure 3 shows the plotted CWS 2 field coupon corrosion rates vs. the mild steel corrosion rates calculated with the BWM and the water chemistry data for CWS 2. The plots are weakly correlated (r = –0.104) and lack statistical significance (p = 0.673).1 A time series plot instead of a scatterplot was used to demonstrate this lack of correlation. It revealed the chronological positions of the discrepancies between the CWS 2 field data and the new model BWM data.When CWS 2 water chemistry data were replaced with CWS 1 water chemistry data, it was found that the calculated corrosion rates were statistically significant when correlated with the CWS 2 field coupon-derived corrosion rates (p value <0.0001 and r value = 0.742). As the two cooling systems utilize the same makeup water, they were not expected to have yielded such diverse results. Upon closer scrutiny of the CWS 2 water chemistry data for factors that may have impacted the systems, it was found that phosphate had been excluded from the BWM. A greater impact due to fluoride was incorporated into the model, so that a modified BWM (an R2 of 85%) using Equation (2) was used:

where fluoride (F) and phosphate (PO4) are measured in mg/L.


The good correlation between both the CWS 1 and CWS 2 field corrosion data and the BWM corrosion results calculated using the CWS 1 water chemistry, and the fact that a modified BWM had to be developed to achieve a good correlation between the CWS 2 corrosion and its water chemistry, indicated a possible irregularity in the CWS 2 water chemistry data. Although the two cooling water systems received the same brackish makeup water, there were significant differences in their operating conditions, particularly the oil removal rates. Generally, the amount of oil present in CWS 2 (Figure 4) was higher than for CWS 1, whereas the opposite was generally apparent for phosphate (Figure 5) and fluoride.
Conclusions
The empirically derived prediction model for mild steel corrosion in brackish water—BWM—predicted with reasonable accuracy the CWS 1 corrosion, as shown by the statistically strong correlation (r = 0.92) with the actual plant mild steel coupon data and the linear fit with an R2 of 87%. The application of the BWM to CWS 2 was totally inadequate. An examination of the factors initially excluded from the BWM (phosphate, fluoride, and oil concentrations) revealed that the inclusion of phosphate and fluoride resulted in a modified equation with an R2 of 85%. Mill process contaminants such as oil were therefore deemed responsible for the inaccuracy of the BWM using the CSW 2 water chemistry.
Acknowledgments
The author is thankful to Buckman Africa (Pty), Ltd. for providing the necessary funding and the use of its laboratories, and to Dr. J. van der Merwe of the University of the Witwatersrand and Mr. G. Combrink of the University of Johannesburg for their technical support.
References
1 A. Palazzo, “The Impact of Fluoride on the Corrosivity of Brackish Water on Mild Steel in Industrial Cooling Systems” (Ph.D. thesis, University of the Witwatersrand, Johannesburg, 2015).
2 J. Tillmans, O. Heublein, “Investigation of the Carbon Dioxide which Attacks Calcium Carbonate in Natural Waters,” Gesundheits Ingenieur 35, 34, (1912): pp. 669-677.
3 W.F. Langelier, “The Analytical Control of Anti-Corrosion Water Treatment,” J. AWWA 28, 10 (1936): pp. 1,500-1,521.
4 J.W. Ryznar, “A New Index for Determining the Amount of Calcium Carbonate Scale Formed by a Water,” J. AWWA 36, 4 (1944): pp. 472-475.
5 P.R. Puckorius, J.M. Brooke, “A New Practical Index for Calcium Carbonate Scale Prediction in Cooling Tower Systems,” Corrosion 90, 99 (1990).
6 T.E. Larson, R.V. Skold, “Corrosion and Tuberculation of Cast Iron,” J. AWWA 49, 10 (1957): pp. 1,294-1,302.
7 R.A. Pisigan, J. E. Singley, “Evaluation of the Corrosivity Using the Langelier Index and relative Corrosion Rate Models,” Corrosion 84, 149 (1984).
8 D.L. Piron, et al., “Corrosion Rate of Cast Iron and Copper Pipe by Drinking Water,” Corrosion Monitoring in Industrial Plants Using Nondestructive Testing and Electrochemical Methods, G.C. Morgan and P. Labine, eds. (West Conshohocken, PA: ASTM, 1986).
9 “Internal Corrosion of Water Distribution Systems, 2nd ed. A Cooperative Research Report,” AWWA, #725, 1996, pp. 29-70.
10 V.D. Moll, et al., “The Kinetics and Mechanism of the Localized Corrosion of Mild Steel in Neutral Phosphate-borate Buffer Containing Sodium Fluoride,” Corros. Sci. 25, 4 (1985): 239-252.
11 A. Macias, M.L. Escudero, “The Effect of Fluoride on Corrosion of Reinforcing Steel in Alkaline Solutions,” Corros. Sci. 36, 12 (1994): 2,169-2,180.
12 J.J. Dillon, G.B. Waltman, “The Effect of Mold Powders on Corrosion of Continuous Caster Components,” Corrosion 95, 499 (1995): pp. 1-25.
13 ASTM D2688, “Standard Methods for Corrosivity of Water in the Absence of Heat Transfer (Weight Loss Methods)” (West Conshohocken, PA: ASTM, 2015).
14 ASTM G1, “Standard Practice for Preparing, Cleaning, and Evaluating Corrosion Test Specimens” (West Conshohocken, PA: ASTM, 2011).
15 ASTM G31, “Standard Practice for Laboratory Immersion Corrosion Testing of Metals” (West Conshohocken, PA: ASTM, 2012).
*Original article online at http://www.materialsperformance.com/articles/material-selection-design/2017/07/fluoride-corrosivity-on-mild-steel-in-cooling-systems#.WV-zNc3itqQ.twitter