Fluorinated greenhouse gases (F-gases) contribute to climate change and in 2019 made up 2.3% of total EU greenhouse gas emissions. F-gases have a range of applications, particularly in the refrigeration, air conditioning and heat pump sector. Most F-gases have much higher global warming potentials than other greenhouse gases. This briefing outlines the important trends in the EU supply of F-gases for the period 2007-2020 and monitors progress under the hydrofluorocarbon phase-down schemes of the F-gas Regulation and the Montreal Protocol.
Key messages
- In 2020, the total supply of fluorinated gases (F-gases) to the EU increased slightly after a continuous decrease from 2015 to 2019. Refrigeration and air conditioning continue to be key applications for these gases.
- Despite a 7% increase in hydrofluorocarbons (HFC) consumption compared with 2019, EU consumption of HFCs in 2020 was 52% below the maximum imposed by the Montreal Protocol’s Kigali Amendment.
- The EU remains on track under the HFC phase-down phase of the EU F-gas Regulation: EU-wide placing on the market of HFCs in 2020 was 4% below the market limit.
- As available HFC quotas have not been fully needed to cover the demand, the reserve of quota authorisations eligible to cover imports of refrigeration, air conditioning and heat pump equipment under the HFC phase-down continues to grow. The current size of the reserve accounts for about seven times the amount of such equipment imported in 2020 or 111% of the 2021 EU maximum quantity of HFCs.
Hydrofluorocarbons (HFCs) account for the majority of fluorinated gas (F-gas) emissions. To reduce these, the F-gas Regulation (EU) No 517/2014 introduced an EU HFC phase-down scheme and a quota system for companies. Since 2019, the EU has also been bound by an obligation to reduce HFC emissions, agreed internationally under the Kigali Amendment to the Montreal Protocol.
Policy context
The Montreal Protocol was established in 1987 to cut the consumption and production of synthetic substances that destroy the protective ozone layer (ozone-depleting substances, ODS). In the EU, ODS are regulated separately under Regulation (EC) No 1005/2009 (Ozone Regulation). Phasing down ODS has led to the increased use of certain F-gases, most prominently in refrigeration and air conditioning, since the early 1990s, as these chemicals have similar properties to ODS but do not affect the ozone layer. Consequently, emissions of F-gases in the EU, of which more than 90% are HFCs, increased by about 70% between 1990 and 2014.
Because F-gases are potent greenhouse gases, they have been regulated in the EU since 2006. Their emissions have started to decline since peaking in 2014 (13% lower in 2019 in the EU-27 and the UK than in 2014) (EEA, 2021a).
The EU F-gas Regulation (EU, 2014) implements an EU-wide phase-down of HFCs, which started in 2015. Its aim is to cut EU emissions of HFCs by two thirds by 2030 compared with 2014 levels. It mandates companies to report their annual production, imports, exports and other activities involving HFCs and other F-gases and includes all the F-gases covered by the Kyoto Protocol: HFCs, perfluorocarbons (PFCs), sulphur hexafluoride (SF6) and nitrogen trifluoride (NF3) and others such as unsaturated HFCs and HCFCs (hydrochlorofluorocarbons). The F-gas Regulation is presently scheduled for review. The impact assessment as part of a revision proposed by the European Commission is currently ongoing.
The EU’s key objective is to achieve climate neutrality by 2050, with a net reduction target of 55% by 2030 compared with 1990. This has already been adopted as the European Climate Law. The ‘Fit for 55’ package details how to achieve this. F-gases are included in the objective.
Phase-down of HFCs under the EU F-gas Regulation
The HFC phase-down under the F-gas Regulation is implemented by imposing annual quantitative limits (quotas) on the placing of HFCs on the EU market by producers and importers. The EU-wide maximum quantity for HFCs has been subject to a stepwise reduction since 2015, as shown in Figure 1. In 2020, EU-wide placing of HFCs on the market was 4% below the 2020 overall market limit set by the quota system (2% in 2019). The companies that did not fully use their quota counterbalanced the few cases of quota exceedance by importers of bulk HFCs and equipment importers.
As EU industries have been moving to alternatives with low global warming potential (GWP), the demand for HFCs has been decreasing. While the demand for refrigerants remains high, there has been a shift to non-HFC alternatives with lower GWPs. In 2015, the placing on the EU market of bulk HFCs was 85% of the maximum quantity and had decreased by 52% by 2020, a quicker rate of decrease than that for the maximum quantity itself, which fell by 45% over the same period. The balance has largely been converted into quota authorisations, which can be stored over the years and which have been needed by importers of refrigeration, air conditioning and heat pump (RACHP) equipment containing HFCs since 2017.
The supply of quota authorisations has exceeded quota-relevant RACHP equipment imports in all years except 2017. The reserve of quota authorisations, built up during 2015 and 2016, thus continues to grow (+15% year-on-year by the end of 2020). The current size of this reserve accounts for seven times the amount of actual annual equipment imports in 2020 or 111% of the maximum available amount of HFCs for 2021. However, the amount of quota authorisations in 2020 decreased to 35% below 2019 levels but was still above the levels observed between 2015 and 2018.
Illegal HFC imports outside the reporting and compliance system under the F-gas Regulation continue to be alleged, and these cannot be quantitatively accounted for in this briefing. A European Commission study (EC, 2019) concludes that it is not possible to quantify customs evasion and that the HFC phase-down continues to be successful in promoting innovation and a shift towards climate-friendly solutions, particularly as gas prices in the EU remain significantly higher than on the world market.
Figure 1 EU progress of the HFC phase-downs under the EU F-gas Regulation and the Montreal Protocol
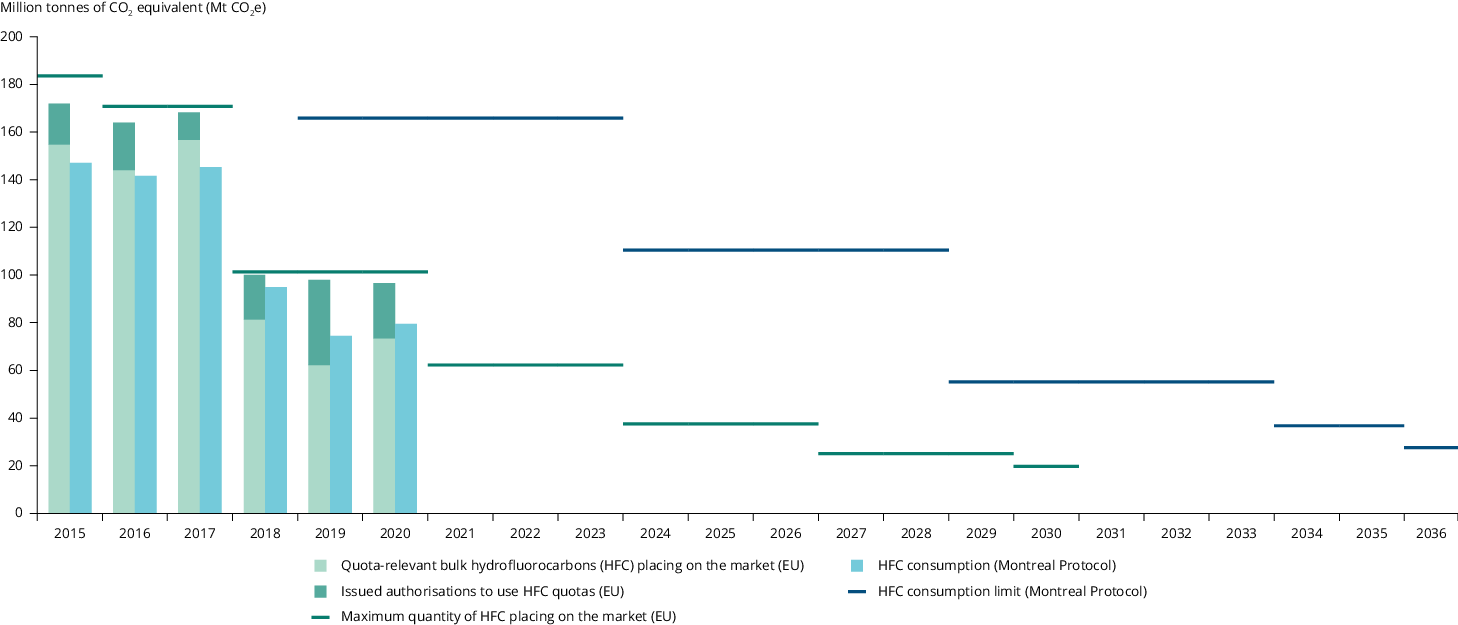
Notes: Values are based on obligations under the new F-gas Regulation (EU) No 517/2014. The geographical scope of the data presented on placing on the market is EU-27 and the UK. The maximum quantities of the EU HFC phase-down shown for 2015-2019 and for 2020 apply to EU-27 and the UK. EU-27 maximum quantities for 2021 onwards have been recalculated to reflect the effects of Brexit. The HFC consumption limits under the Montreal Protocol are still in EU-28 scope for the full 2019-2036 time series, however, they will undergo recalculations to fit the EU-27 scope in the future. Please see Table 27 in the annex to this briefing for a description of the difference between the two metrics: ‘EU placing on the market’, which is relevant for compliance with the EU HFC phase-down, and ‘HFC consumption’, which is relevant for compliance with the Montreal Protocol HFC phase-down.
Mt, million tonnes.
Sources: EC (2021); EEA (2020, 2021b).
More info here…
After significant increases in the number of companies applying for quota until 2019, the European Commission’s increased scrutiny of their legitimacy has reduced the viability of mass registrations (EU, 2019). Consequently, the number of quota-holding companies was significantly lower in 2020. Also as a consequence, the number of companies reporting on bulk HFC imports and quota authorisations in 2020 decreased by about 30% after more than doubling in 2019.
More graphs and data tables relating to compliance with the EU HFC phase-down are provided in the annex to this briefing.
EU contribution to the global phase-down of HFCs under the Kigali Amendment to the Montreal Protocol
The global HFC phase-down under the Montreal Protocol’s Kigali Amendment introduces limits for the consumption of HFCs, starting in 2019. In 2020, HFC consumption in the EU-27 and the UK increased by 7% compared with 2019, but it was still 52% below the 2020 limit for the EU-27 and the UK under the Montreal Protocol’s Kigali Amendment (Figure 1). However, EU compliance with the Montreal Protocol is not assured beyond 2030 in all cases, as the metrics used to regulate F-gas placing on the market under the EU F-gas Regulation and those used to describe the limits on the consumption of HFCs under the Montreal Protocol are different (Öko-Institut et al., 2021).
Supply of F-gases in the EU
The total supply of F-gases was reasonably stable from 2007 until it peaked in 2014, just before the HFC quota system entered into force. After 2015, a downwards trend reflected the effect of the EU HFC phase-down under the F-gas Regulation. The volume of total supply in physical tonnes in 2020 was about 1% higher than in the previous year (Figure 2), with an almost 3% higher GWP in 2020 than in 2019 (Figure 3). Refrigeration and air conditioning continue to be key applications.
An important detail is that statistics in physical tonnes reflect the use patterns of F-gases in EU industries, while the amount of F-gases expressed in carbon dioxide equivalents (CO2e) reflects their potential relevance for climate change policy and the HFC phase-down.
A key driver for the F-gases supply was the HFC supply, which increased by 3% in mass or by 2% in CO2e, compared with 2019. As detailed below, the main reasons behind this increase were higher imports, which more than outweighed a decrease in production.
The supply of unsaturated HFCs and HCFCs with very low GWPs, replacing HFCs with significantly higher GWPs, has decreased by 5% and stabilised close to 2018 levels at about 30% of the HFC supply. When comparing the gases with the highest GWPs for the years 2019 and 2020, there was a 12% increase for SF6, and, less relevant for overall F-gas supply in CO2e, an 8% increase for NF3 and an 18% decrease for PFCs.
Figure 2 Supply, production, import, export and destruction of F-gases (tonnes)

Notes: The geographical scope of the data presented is EU-27 and the UK (except Croatia) for 2007-2008 and EU-27 and the UK for 2009-2019 and 2020. Annex II F-gases (unsaturated HFCs and HCFCs, hydrofluoroethers (HFEs), alcohols and ‘other’ perfluorinated compounds) and HFCs, PFCs and SF6 in products and equipment were not subject to reporting for the period 2007-2013. Data presented for import and supply between 2007 and 2013 are thus limited to bulk import and bulk supply. Export is limited to bulk export for the whole time series. Data available for Croatia for the period 2009-2012 are limited to HFCs and do not cover PFCs and SF6.
Sources: EC (2011, 2014); EEA (2020, 2021b).
More info here…
Figure 3 Supply, production, import, export and destruction of F-gases (CO2e)
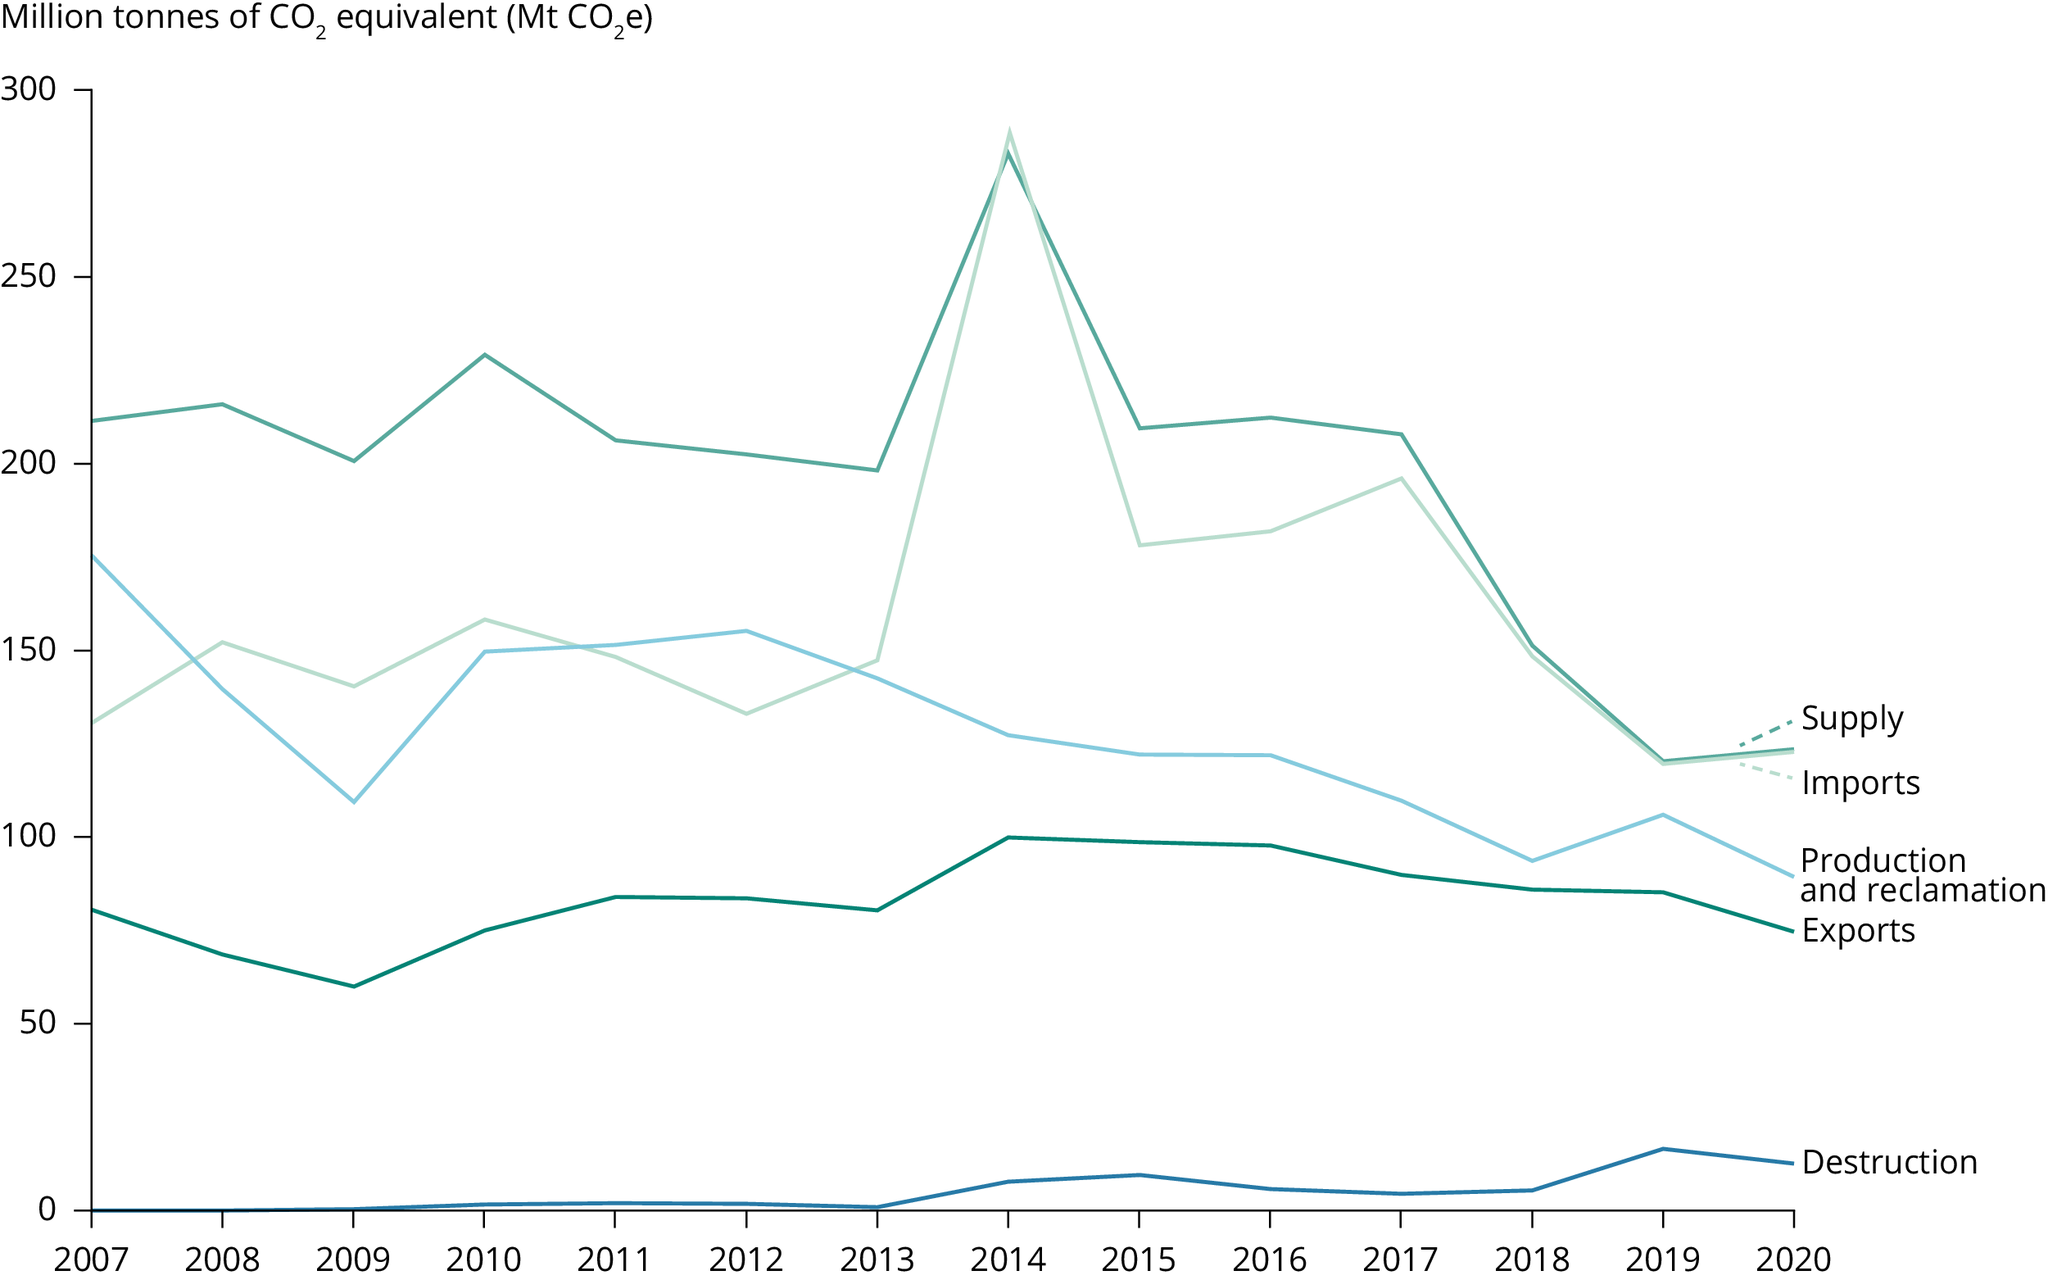
Notes: The geographical scope of the data presented is EU-27 and the UK (except Croatia) for 2007-2008 and EU-27 and the UK for 2009-2019 and for 2020. Annex II F-gases (unsaturated HFCs and HCFCs, hydrofluoroethers (HFEs), alcohols and ‘other’ perfluorinated compounds) and HFCs, PFCs and SF6 in products and equipment were not subject to reporting for the period 2007-2013. Data presented for import and supply between 2007 and 2013 are thus limited to bulk import and bulk supply. Export is limited to bulk export for the whole time series. Data available for Croatia for the period 2009-2012 are limited to HFCs and do not cover PFCs and SF6.
Sources: EC (2011, 2014); EEA (2020, 2021b).
More info here…
The trend in F-gas supply in the EU reflects trends in physical flows of F-gases: production, reclamation, imports, exports and destruction in the EU-27 and the UK.
- Production of F-gases has seen a steady decline since 2012. In 2020, production of F-gases decreased again compared with 2019, both in production volume (-17%) and in GWP (-16%).
- The quantities reported as reclaimed F-gases increased by about 6% in volume compared with 2019 while decreasing by 9% in GWP. This is mostly driven by a decrease in SF6 reclamation (-42%). While reclaimed HFCs increased by 8% in tonnes, there was a decrease of 1% in GWP, mostly based on a decrease in R-404A and an increase in HFC-134a.
- Reclaimed HFCs now account for 11% of EU production of virgin HFCs, or 3% of total EU HFC supply (or 10% and 4%, respectively, as CO2e). While 97% of reclaimed amounts are HFCs, SF6 contributes to 15% of the GWP of reclaimed gas.
- After strongly decreasing for 2 years, total F-gas imports in 2020 decreased by only 1%, while there was an increase of 3% in CO2e. Imports of HFCs in mass increased by 3%, offset by a 13% decrease in unsaturated HFCs and HCFCs. The trend measured in CO2e showed a 5% increase in HFC imports and some decreases for gases with very high GWPs: PFCs, SF6 and NF3.The share of HFCs in total 2020 imports was 77% in mass and 84% in CO2e. The trend observed for 2020 bulk HFC imports (+9% as CO2e) may have been a reaction to unprecedentedly low imports in 2019 but may possibly also be due to stockpiling in advance of the 2021 step down in the HFC phase-down. Imports of F-gases contained in products and equipment appear to have levelled off since 2016.
- In 2020, overall bulk exports of F-gases from the EU-27 and the UK continued their strong decrease since 2017 and decreased by about 6% compared with 2019. A similar decrease of 7% is visible in CO2e. The trend depends on the gas: 2020 HFC exports were about 6% lower than in 2019 while remaining almost constant in terms of GWP. For SF6, 2020 exports were about 21% lower than in 2019, which is in line with the decrease in the production of SF6. Exports of F-gases contained in products and equipment are not subject to obligatory reporting.
- Destruction and feedstock use of F-gases is mainly reported for HFCs. The amounts destroyed decreased by 24% in 2020 after more than doubling the year before. HFC amounts used as feedstock for chemical production processes have increased by 11% compared to 2019.
More graphs and tables summarising data reported by companies on the production, import, export and destruction of F-gases in the EU, for the period 2007-2020, are contained in the annex to this briefing. The annex also documents the methodology used, in particular for the calculation of the supply, placing on the market and consumption metrics, and institutional arrangements.
References
EC, 2011, ‘Fluorinated greenhouse gases 2010 — Data reported by companies on the production, import and export of fluorinated greenhouse gases in 2010’, Confidential report to the European Commission and Member States’ Competent Authorities, Umweltbundesamt, Vienna.
EC, 2014, ‘Croatian HFC imports and exports 2009-2012’, Confidential data set considered for the calculation of reference values for Croatian companies, DG CLIMA, European Commission, Brussels.
EC, 2019, ‘Indications of illegal HFC trade based on an analysis of data reported under the F-gas Regulation’, Eurostat dataset and Chinese export data, October 2019, DG CLIMA, European Commission, Brussels.
EC, 2021, ‘Confidential data set extracted from the HFC Registry’, 15 April 2021, DG CLIMA, European Commission, Brussels.
EU, 2014, Regulation (EU) No 517/2014 of the European Parliament and of the Council of 16 April 2014 on fluorinated greenhouse gases and repealing Regulation (EC) No 842/2006 (OJ L 150, 20.5.2014, p. 195-230).
EU, 2019, Commission Implementing Regulation (EU) 2019/661 of 25 April 2019 ensuring the smooth functioning of the electronic registry for quotas for placing hydrofluorocarbons on the market (OJ L 112, 26.4.2019, p. 11-15).
EEA, 2020,Fluorinated greenhouse gases 2020 — Data reported by companies on the production, import and export of fluorinated greenhouse gases in the European Union, 2007-2019, EEA Report No 15/2020, European Environment Agency.
EEA, 2021a, ‘EEA greenhouse gas data viewer’, European Environment Agency, accessed 18 August 2021.
EEA, 2021b, ‘Fluorinated greenhouse gases 2021’, Confidential data set: compilation and analysis of data reported by companies on the production, import, export and destruction of fluorinated greenhouse gases in the European Union, European Environment Agency.
Öko-Institut, Ricardo and Öko-Recherche, 2021, Evaluation and impact assessment for amending Regulation (EU) No 517/2014 on fluorinated greenhouse gases, Briefing paper for the stakeholder workshop on preliminary findings, 6 May 2021, accessed 13 September 2021.
*Original article online at https://www.eea.europa.eu/publications/fluorinated-greenhouse-gases-2021