Key findings
Data from the National Health and Nutrition Examination Survey
- For 2015–2016, prevalence of total caries (untreated and treated) was 43.1% and untreated caries was 13.0% among youth aged 2–19 years.
- Prevalence was lowest in youth aged 2–5 years compared with those aged 6–11 and 12–19 for total (17.7%, 45.2%, 53.5%) and untreated caries (8.8%, 15.3%, 13.4%).
- Hispanic youth had the highest prevalence of total caries; non-Hispanic black youth had the highest prevalence of untreated caries.
- For both total and untreated caries, prevalence decreased as family income level increased.
- Total caries prevalence declined from 2011–2012 (50.0%) to 2015–2016 (43.1%). For untreated caries, prevalence increased from 2011–2012 (16.1%) to 2013–2014 (18.0%), and then decreased in 2015–2016 (13.0%).
Dental caries is the most common chronic disease among youth aged 6–19 years (1). Untreated caries can cause pain and infections (2,3). Monitoring prevalence of untreated and total caries (untreated and treated) is key to preventing and controlling oral diseases. This report presents the prevalence of total and untreated caries in primary or permanent teeth among youth aged 2–19 years for 2015–2016, and trends from 2011–2012 through 2015–2016.
Keywords: tooth decay, dental cavity, caries experience, NHANES
What was the prevalence of total and untreated dental caries in youth for 2015-2016?
The prevalence of total dental caries (untreated and treated) in primary or permanent teeth among youth aged 2–19 years was 43.1% (Figure 1). Prevalence increased with age, going from 17.7% among youth aged 2–5 to 45.2% among those aged 6–11 to 53.5% among those aged 12–19.
The prevalence of untreated caries in primary or permanent teeth among youth aged 2–19 years was 13.0%. The prevalence among youth aged 2–5 (8.8%) was lower than it was among youth aged 6–11 (15.3%) and 12–19 (13.4%).
Figure 1. Prevalence of total dental caries and untreated dental caries in primary or permanent teeth among youth aged 2–19 years, by age: United States, 2015–2016
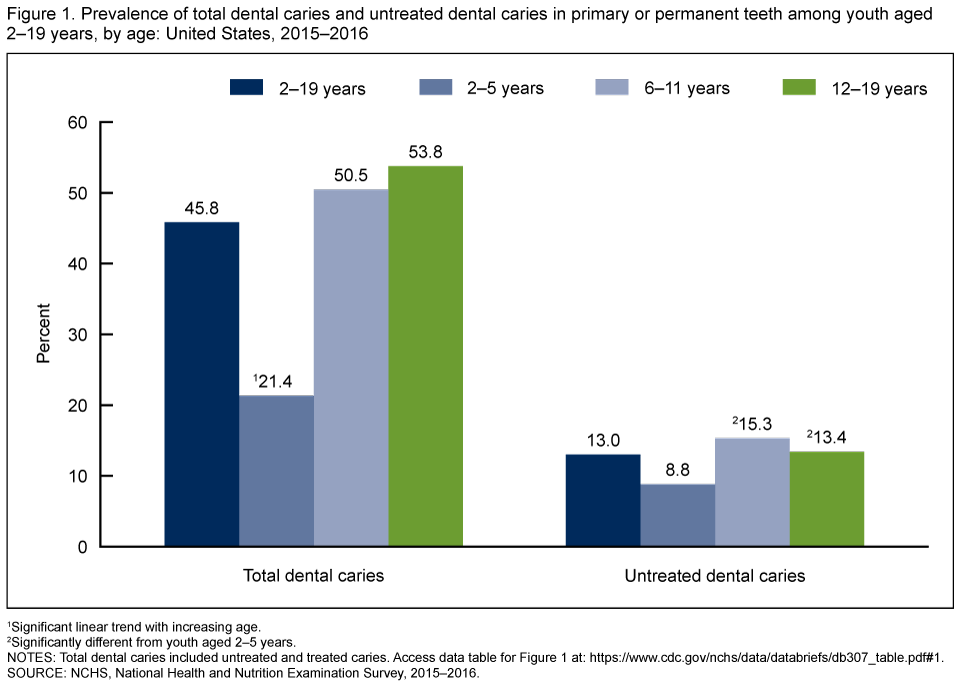 1Significantly different from youth aged 2–5 years.
2Significant linear trend with increasing age.
NOTES: Total dental caries include untreated and treated caries. Access data table for Figure 1.
SOURCE: NCHS, National Health and Nutrition Examination Survey, 2015–2016.
Did the prevalence of total and untreated dental caries differ among youth by race and Hispanic origin for 2015-2016?
Among youth aged 2–19 years, the prevalence of total dental caries was highest for Hispanic youth (52.0%) compared with non-Hispanic black (44.3%), non-Hispanic Asian (42.6%), and non-Hispanic white (39.0%) youth (Figure 2). However, the difference between the prevalence for Hispanic youth and non-Hispanic black youth did not reach statistical significance.
The prevalence of untreated dental caries was highest among non-Hispanic black (17.1%) youth compared with Hispanic (13.5%), non-Hispanic white (11.7%), and non-Hispanic Asian (10.5%) youth. However, the difference between the prevalence for non-Hispanic black youth and Hispanic youth did not reach statistical significance.
Figure 2. Prevalence of total dental caries and untreated dental caries in primary or permanent teeth among youth aged 2–19 years, by race and Hispanic origin: United States, 2015–2016
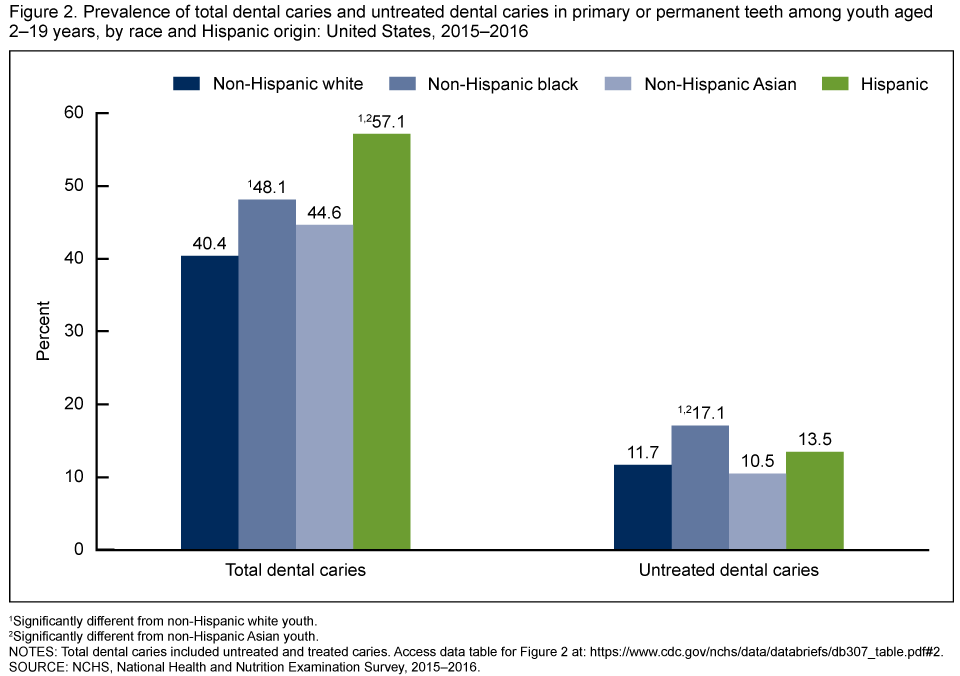 1Significantly different from non-Hispanic white youth.
2Significantly different from non-Hispanic Asian youth.
NOTES: Total dental caries include untreated and treated caries. Access data table for Figure 2.
SOURCE: NCHS, National Health and Nutrition Examination Survey, 2015–2016.
Were there differences in the prevalence of total and untreated dental caries among youth by income level for 2015-2016?
The prevalence of total dental caries decreased as family income levels increased, from 51.8% for youth from families living below the federal poverty level to 34.2% for youth from families with income levels greater than 300% of the federal poverty level (Figure 3).
The prevalence of untreated dental caries decreased from 18.6% for youth from families living below the federal poverty level to 7.0% for youth from families with incomes greater than 300% of the federal poverty level.
Figure 3. Prevalence of total dental caries and untreated dental caries in primary or permanent teeth among youth aged 2–19 years, by federal poverty level: United States, 2015–2016
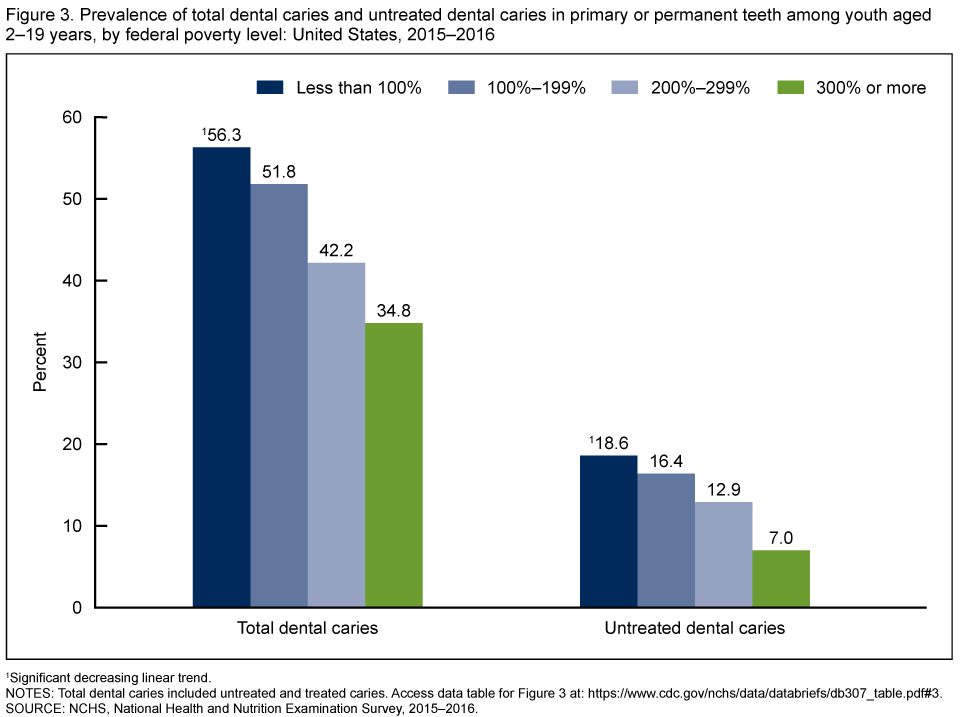 1Significant decreasing linear trend.
NOTES: Total dental caries include untreated and treated caries. Access data table for Figure 3.
SOURCE: NCHS, National Health and Nutrition Examination Survey, 2015–2016.
What are the trends in total and untreated dental caries in youth from 2011-2012 through 2015-2016?
A significant linear decrease was seen in the prevalence of total dental caries (from 50.0% to 43.1%) in youth from 2011–2012 through 2015–2016.
For untreated dental caries, the prevalence was 16.1% for 2011–2012, with the percentage increasing to 18.0% for 2013–2014, and then declining to 13.0% for 2015–2016 (Figure 4).
Figure 4. Trends in prevalence of total dental caries and untreated dental caries in primary or permanent teeth among youth aged 2–19 years: United States, 2011–2012 through 2015–2016
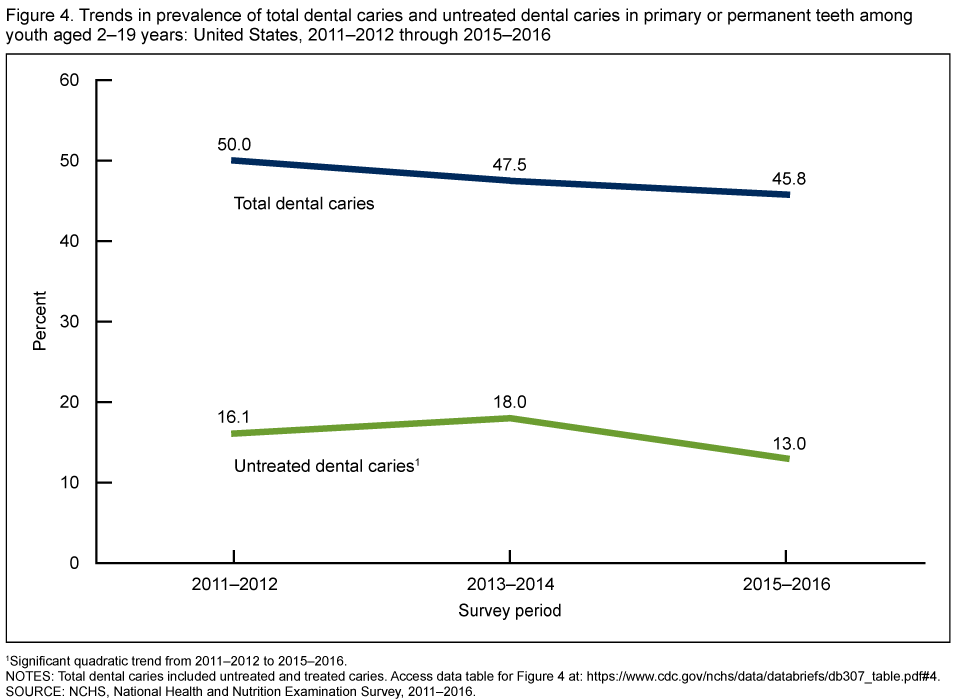 1Significant decreasing linear trend from 2011–2012 to 2015–2016.
2Significant quadratic trend from 2011–2012 to 2015–2016.
NOTES: Total dental caries include untreated and treated caries. Access data table for Figure 4.
SOURCE: NCHS, National Health and Nutrition Examination Survey, 2011–2016.
Summary
For National Health and Nutrition Examination Survey (NHANES) period 2015–2016, the prevalence of total and untreated dental caries in primary or permanent teeth among youth aged 2–19 years was 43.1% and 13.0%, respectively. For both total and untreated caries, prevalence was lowest among those aged 2–5 years.
The prevalence of total dental caries was highest for Hispanic youth compared with other race and Hispanic-origin groups. The prevalence of untreated dental caries was highest for non-Hispanic black youth.
The prevalence of total and untreated dental caries decreased as family income levels increased. Youth in families with incomes greater than 300% of the federal poverty level had the lowest prevalence of both untreated and total dental caries.
The prevalence of total dental caries declined in youth during the 6 years from survey period 2011–2012 through 2015–2016. The prevalence of untreated dental caries increased from 2011–2012 through 2013–2014, and then declined for 2015–2016.
Definitions
Income: Based on the federal poverty level, which is the ratio of household income to the poverty guidelines after accounting for inflation and family size.
Total dental caries: Treated and untreated tooth decay (dental cavity) in primary or permanent teeth.
Untreated dental caries: Tooth decay (dental cavity) in primary or permanent teeth that has not received appropriate treatment.
Data Source and Methods
NHANES is a cross-sectional survey conducted by the National Center for Health Statistics (NCHS) designed to monitor the health and nutritional status of the civilian noninstitutionalized U.S. population (4). It consists of home interviews followed by standardized physical examinations in mobile examination centers (MEC). The NHANES sample is selected through a complex, multistage probability design. For 2015–2016, non-Hispanic black, non-Hispanic Asian, and Hispanic persons were oversampled; for more information, visit the NHANES website. The NHANES caries assessment is a comprehensive dental surface-by-dental surface evaluation for the presence of untreated caries and dental restorations conducted by trained dentists at the MEC (5).
Examination weights were used to account for the differential probabilities of selection, nonresponse, and noncoverage. Taylor series linearization was used to compute variance estimates. Differences between groups were evaluated using a univariate t statistic at the p less than 0.05 significance level. All reported estimates meet NCHS presentation standards (6). Linear regression modeling was used to determine the significance of linear trends. Calculated estimates were not age adjusted. Statistical analyses were conducted using SAS-callable SUDAAN version 11.0 (RTI International, Research Triangle Park, N.C.).
About the Authors
Eleanor Fleming is with the National Center for Health Statistics, Division of Health and Nutrition Examination Surveys. Joseph Afful is with Peraton Corporation.
References
- U.S. Department of Health and Human Services. Oral health in America: A report of the Surgeon General, Executive summary. Rockville, MD: National Institutes of Health, National Institute of Dental and Craniofacial Research. 2000.
- Seirawan H, Faust S, Mulligan R. The impact of oral health on the academic performance of disadvantaged children. Am J Public Health 102(9):1729–34. 2012.
- Jackson SL, Vann WF Jr, Kotch JB, Pahel BT, Lee JY. Impact of poor oral health on children’s school attendance and performance. Am J Public Health 101(10):1900–6. 2011.
- Johnson CL, Dohrmann SM, Burt VL, Mohadjer LK. National Health and Nutrition Examination Survey: Sample design, 2011–2014. National Center for Health Statistics. Vital Health Stat 2(162). 2014.
- National Center for Health Statistics. National Health and Nutrition Examination Survey (NHANES): Examination manuals, 2011–2012, 2013–2014, 2015–2016.
- Parker JD, Talih M, Malec DJ, Beresovksy V, Carroll M, Gonzalez JF Jr, et al. National Center for Health Statistics Data Presentation Standards for Proportions. National Center for Health Statistics. Vital Health Stat 2(175). 2017.
Suggested Citation
Fleming E, Afful J. Prevalence of total and untreated dental caries among youth: United States, 2015–2016. NCHS Data Brief, no 307. Hyattsville, MD: National Center for Health Statistics. 2018.
National Center for Health Statistics
Charles J. Rothwell, M.S., M.B.A., Director
Jennifer H. Madans, Ph.D., Associate Director for Science
Division of Health and Nutrition Examination Surveys
Kathryn S. Porter, M.D., M.S., Director
Ryne Paulose-Ram, Ph.D., Associate Director for Science
*Original report online at https://www.cdc.gov/nchs/products/databriefs/db307.htm