Figures: Teeth
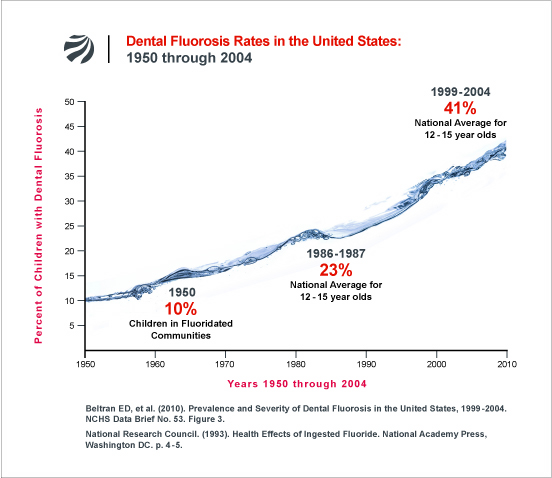
FIGURE 1: Dental Fluorosis Rates in the United States: 1950-2004
When the U.S. Public Health Service endorsed water fluoridation in the early 1950s, it was estimated that 10% of children in fluoridated areas would develop dental fluorosis, and only in its very mild and mild forms. (NRC 1993). In the 1980s, it became evident that the rate of fluorosis in American children was far higher than predicted. In the National Institute of Dental Research’s national oral health survey in 1986-87, it was found that the average fluorosis rate in the nation (including both fluoridated and unfluoridated areas) was 22%. The respective rate in fluoridated areas was 29%. (Heller 1997). The the fluorosis rate has continued to increase since the 1980s. In 2010, the CDC announced that a remarkable 41% of U.S. adolescents now have fluorosis, with 3.6% of children having the moderate/severe form. The CDC did not provide the fluorosis rate for children in fluoridated areas, but it would obviously be higher than 41%. Indeed, studies in fluoridated areas have found the fluorosis rate to be as high as 75 to 80%.
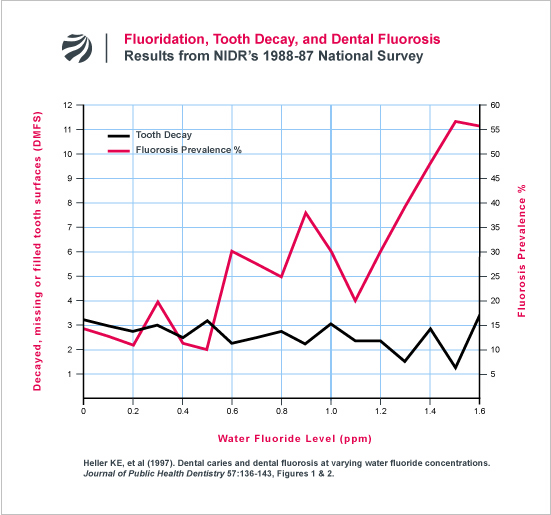
FIGURE 2: Dental Fluorosis & Tooth Decay as a Function of Water Fluoride Level
In 1997, a team of University of Michigan dental researchers displayed the national tooth decay and dental fluorosis rate as a function of the fluoride level in the children’s water supply. (Heller 1997) The researchers obtained the data from the NIDR’s 1986-87 survey. When displayed graphically, the NIDR’s survey results highlight a weak relationship between fluoride level and tooth decay, but a strong relationship between fluoride level and dental fluorosis.
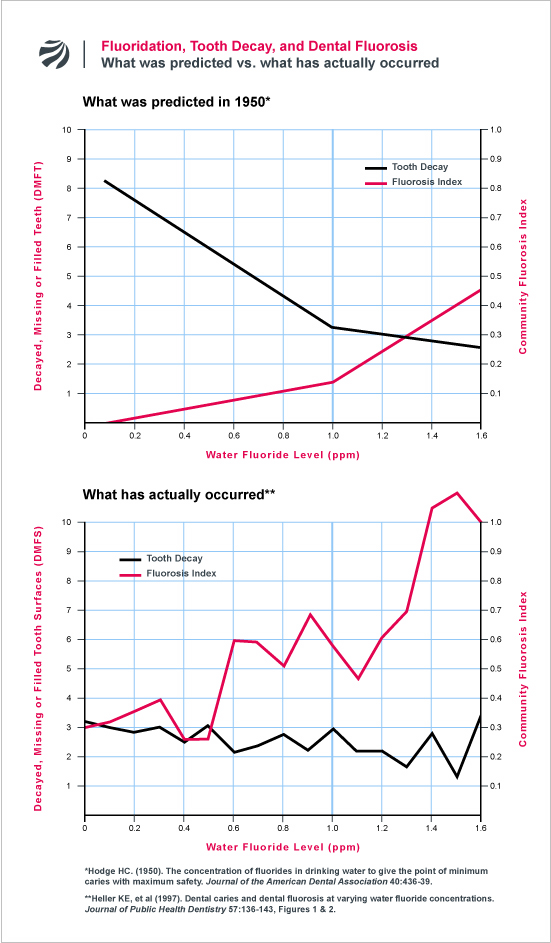
FIGURE 3: What Was Predicted Versus What Has Actually Occurred
In 1950, Harold Hodge published an frequently cited paper in the Journal of the American Dental Association which analyzed existing data on the relationship between fluoride in water, tooth decay, and dental fluorosis. In the paper, Hodge marveled at the “happy coincidence” that the fluoride level in water that dramatically reduced tooth decay (1 ppm) was associated with virtually no dental fluorosis. To demonstrate this, Hodge created a figure which showed tooth decay plummeting from o to 1 ppm, while the fluorosis rate (the “community fluorosis index“) only began to sharply increase at levels greater than 1 ppm. Hodge emphasized the “incredible” nature of this finding and recommended that dentists share it with any patient who expressed concerns about fluoridation. According to Hodge:
“If a patient comes into the office with a series of questions about fluorides, the busy practitioner might not have at his finger tips a quick, easily grasped answer. Suppose the patient asks how much good fluorides will do if they are put in the drinking water and how we know that they are safe. Answers can be given briefly and convincingly by a little sketch made of two straight lines.”
Hodge’s predictions, however, have not aged well.
The following figure contrasts Hodge’s predictions with the actual results after 30+ years of fluoridation. The data, taken from NIDR’s national survey in 1986-87, shows, at best, a weak reduction in tooth decay from o to 1 ppm. It also shows that the fluorosis index goes far higher than Hodge had predicted. Whereas Hodge estimated that the fluorosis index would rise to about 0.14 at 1 ppm, the NIDR study found that it rose to about 0.6, or four times higher than Hodge had predicted.
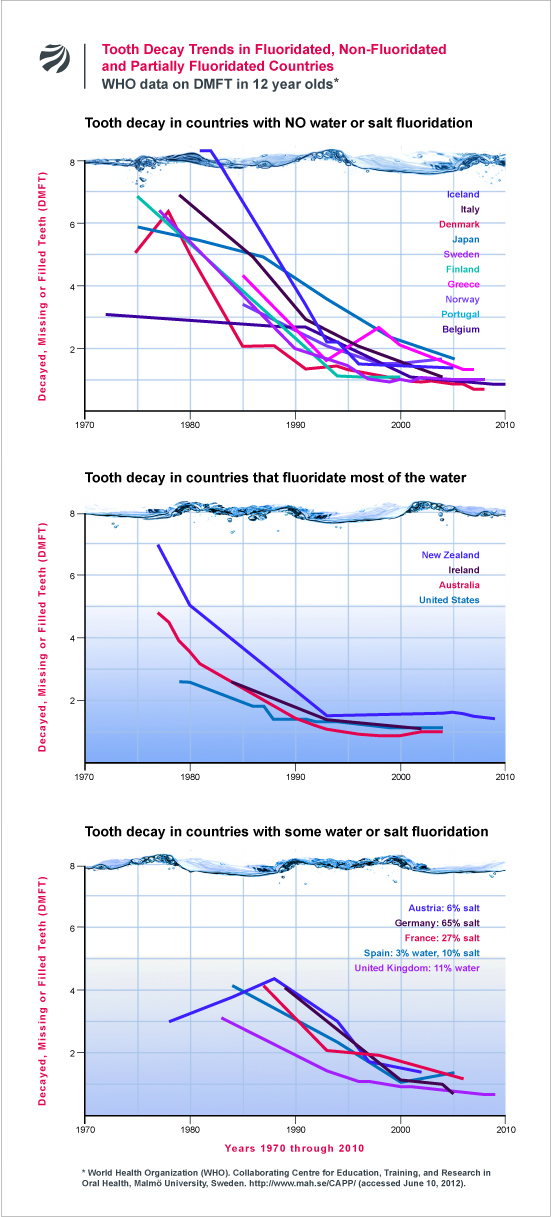
Figure 4: Tooth Decay Trends in Fluoridated vs. Non-Fluoridated Countries:
Fluoride advocates often claim that the reduction in tooth decay that has occurred since the 1950s is the result of the widespread introduction of fluoridated water. In 1999, for example, the Centers for Disease Control stated that ”as a result [of water fluoridation], dental caries declined precipitously during the second half of the 20th century.” What the CDC and other fluoride advocates have failed to address is the fact that tooth decay rates have declined in all western countries, most of which do not fluoridate their water. The following figure compares the tooth decay rates in various developed countries using data compiled by the World Health Organization.
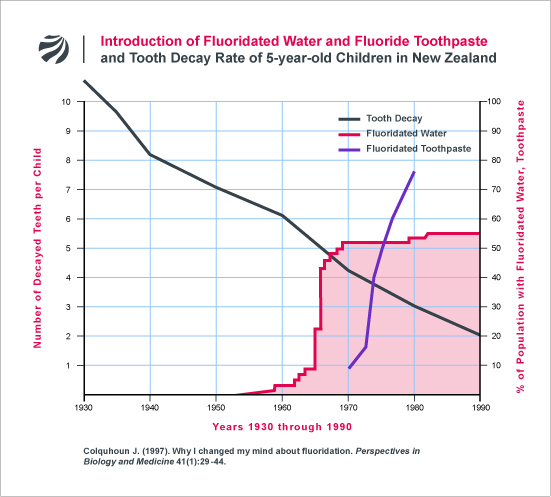
Figure 5: The Mystery of Declining Tooth Decay
In a 1986 paper published in the prestigious journal Nature, author Mark Diesendorf discussed data indicating that the decline of tooth decay had often begun prior to the introduction of water fluoridation in many areas. Following Diesendorf’s analysis, the former Chief Dental Officer for Auckland, New Zealand, John Colquhoun compared the trends in tooth decay rates before, during, and after the introduction of both water fluoridation and fluoride toothpaste in New Zealand (among 5-year-old children). As reproduced in the following figure, Colquhoun found that the introduction of water fluoridation and fluoride toothpaste had no measurable effect on the nation’s downward trend in tooth decay.

