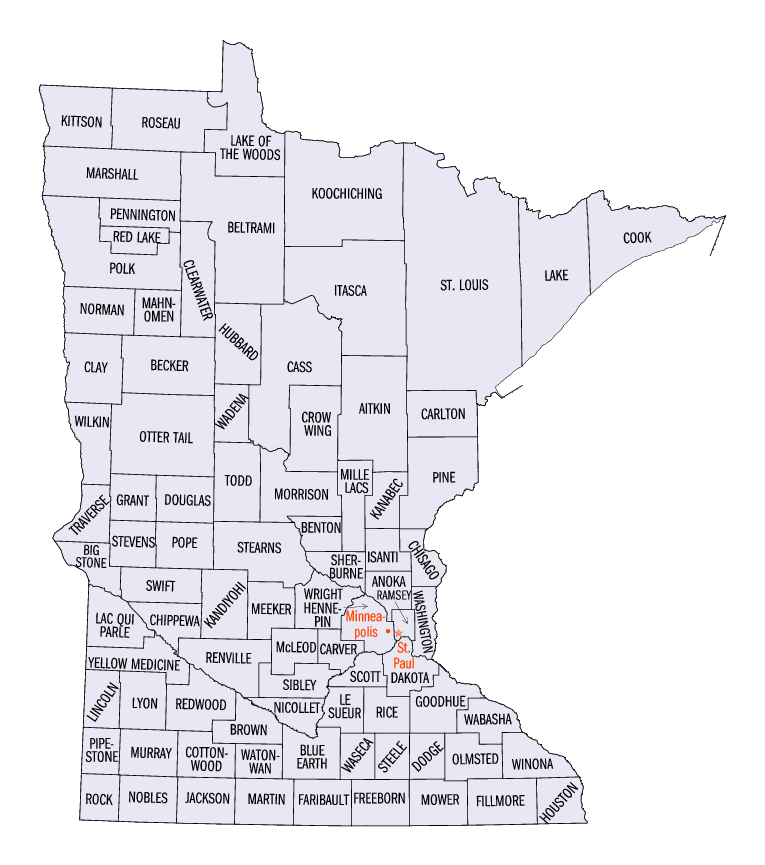
Minnesota (1993)
Unless otherwise noted, the following information comes from the Fluoridation Census 1992 published by the Centers for Disease Control and Prevention, Division of Oral Health, in 1993.
• It is not known if the water systems listed below are all still active
• The state Water System ID is the same as EPA’s preceded with the state’s initial. For example, Minnesota would be MN0000000

State |
Water Systems |
County |
EPA ID No. |
Population |
Natural Level of Fluoride (ppm) |
|
A Milligram per Liter (mg/L) is the same as Part Per Million (ppm) Not all water fluoride levels are included in the Fluoridation Census 1992 |
|||||
| Minnesota | Fransten MHP | Cottonwood | 1170007 | 42 | 0.7 |
| Minnesota | Hanley Falls | Yellow Medicine | 1870005 | 265 | 0.8 |
| Minnesota | Revere | Redwood | 1640010 | 158 | 0.9 |
| Minnesota | Roseland | Kandiyohi | 1340009 | 60 | 1.0 |
| Minnesota | Shelly | Norman | 1540007 | 225 | 1.0 |
| Minnesota | Walnut Grove | Redwood | 1640014 | 700 | 1.0 |
| Minnesota | Campbell | Wilken | 1840003 | 339 | 1.1 |
| Minnesota | Karlstad | Kittson | 1350002 | 936 | 1.2 |
| Minnesota | Milroy | Redwood | 1640005 | 252 | 1.4 |
| Minnesota | Johnson | Big Stone | 1060006 | 56 | 1.5 |
| Minnesota | Prinsburg | Kandiyohi | 1340007 | 600 | 1.8 |
| Minnesota | Kent | Wilkin | 1840004 | 131 | 2.1 |
| Minnesota | Strandquist | Marshall | 1450010 | 136 | 3.1 |
| Minnesota | Wanda | Redwood | 1640015 | 100 | 3.2 |
Notes:
See also, Fluoridated School Drinking Water Systems. Certain elementary schools in Minnesota had their drinking water fluoridated at 5.4 ppm from early 1970s to the 1990s.
Please email Fluoride Action Network if you have information to share on levels of naturally occurring fluoride in U.S. drinking water or other bodies of water.
Percentage of State Population served by Public Water Systems that Receive Fluoridated Water |
|||||
| State | 2014 | 2012 | 2006 | 2000 | 1992 |
| Minnesota | 98.8% | 98.8% | 98.7% | 98.2% | 93.4% |
