When the U.S. Environmental Protection Agency (EPA) established the maximum “safe” level of fluoride for U.S. water supplies at 4 ppm, it stated that “skeletal fluorosis has not been described in populations whose water supplies contained less than 4 mg/L fluoride.” (EPA Criteria Doc, 1985, p. 48) Although the EPA recognized that skeletal fluorosis was a widespread public health in some areas of India and other developing countries, it implied that skeletal fluorosis only occurred in these areas when the fluoride level in water exceeded 10 ppm. According to EPA:
“EPA notes that crippling skeletal fluorosis, rheumatic attack, pain and stiffness have been observed in a large number of individuals in other countries chronically exposed to fluoride in drinking water at levels of 10 mg/L to 40 mg/L.” (EPA, Federal Register, Nov. 14, 1985, p. 47144).
In sharp contrast to EPA’s assertions, scientists in India and China have repeatedly found that skeletal fluorosis occurs in populations drinking water with far less than 4 ppm fluoride, and indeed below 1 ppm (the purported “optimal” level that U.S. water supplies add to water in fluoridation programs). Excerpts and data from these studies is provided below.
Although nutritional deficiencies and hot climates may make populations in India and China more susceptible to fluoride toxicity than is generally the case in western countries, this fact does not remove the relevance of the Indian and Chinese experience to the situation in fluoridating countries. This is because (a) nutritional deficiencies also exist in the western world, particularly in low-income communities, and (b) some individuals, including those with kidney disease, can be just as — if not more — susceptible to fluoride toxicity. Adding additional cause for concern is the conspicuous absence of systematic research in fluoridating countries to determine the prevalence of skeletal fluorosis. This is concerning when considering that Mayo Clinic doctors in the United States have reported cases of skeletal fluorosis among individuals with kidney disease drinking water with as little as 1.7 ppm. (Johnson 1979; Juncos 1972). According to the Mayo Clinic doctors, “systemic fluorosis in patients with diminished renal function . . . seems a reasonable possibility” in areas with artificially fluoridated drinking water. (Juncos 1972).
FIGURES:
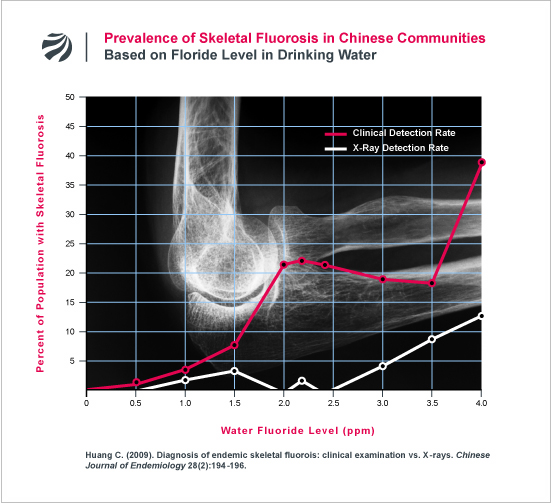
Huang (2009)
The following data from China demonstrates two important points: First, skeletal fluorosis is found in communities with less than 1 ppm fluoride in the water. Second, many people who are diagnosed as having skeletal fluorosis (based on their clinical symptoms) do not have skeletal fluorosis that is radiologically detectable by x-ray. This latter point is a crucial one because U.S. health authorities have long relied exclusively on x-rays for diagnosing skeletal fluorosis. As the following data demonstrates, a focus on radiological fluorosis will fail to detect, and protect, many people with skeletal fluoride poisoning.
- To read FAN’s translation of Huang’s study, click here
- To read China’s criteria for “clinical” and “x-ray” fluorosis that was used in this study, click here.
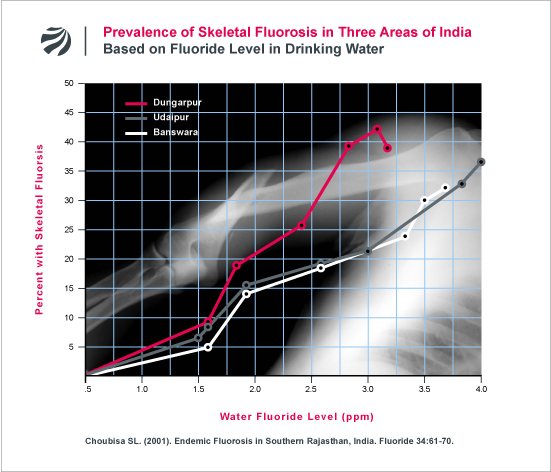
Choubisa (2001)
The following data presents the skeletal fluorosis rate (based on clinical symptoms) in three areas of Southern Rajasthan, India. The lowest average fluoride level in the three areas was 1.5 ppm and 1.6 ppm. In the three areas with these levels of fluoride, the skeletal fluorosis rate was found to range between 5 and 10 percent of the population.
- To see the full text of this study, click here.
EXCERPTS FROM THE SCIENTIFIC LITERATURE:
“There are some skeletal fluorosis when fluoride concentration in drinking water is at level of 0.24 – 1.0 mg/L.”
SOURCE: Dai G, et al. (2004). Distributive regulation of bone substance change in various population sub-groups with different fluoride concentrations in drinking water. Chinese Journal of Endemiology. Available at: http://en.cnki.com.cn/Article_
“There was skeletal fluorosis in the area of containing 0.8 – 1.0mg/L fluoride.”
SOURCE: Dai G, et al. (1988). Quantitative epidemiological research on the relationship between fluoride concentration of drinking water and endemic fluoride poisoning. Chinese Journal of Endemiology 7(1):21-26.
“Skeletal fluorosis in India and China has been reported to occur when the fluoride concentration in water exceeds 1 ppm, and has been found to occur in communities with only 0.7 ppm. The Chinese government now considers any water supply containing over 1 ppm fluoride a risk for skeletal fluorosis.” SOURCE: Gupta R, Kumar AN, Bandhu S, Gupta S. (2007) Skeletal fluorosis mimicking seronegative arthritis. Scandanavian Journal of Rheumatology 36(2):154-5.
“It is also generally stated that a dose of 10–20 mg/day (equivalent to 5–10 ppm in the water, for a person who ingests 2 L/day) for at least 10 years is necessary to develop crippling skeletal fluorosis. But, the research in India provides credible evidence for a striking contrast to these perceptions as most of the information relating to endemic fluorosis has originated from India where skeletal fluorosis has been associated with water-borne fluoride concentrations of 2 to 3 ppm or lower and even at 0.7 ppm. It is observed that in many populations of India, skeletal fluorosis can occur at a minimum fluoride level of 1.35 ppm and crippling form of skeletal fluorosis at or above 2.8 ppm, given the presence of predisposing factors.”
SOURCE: Ayoob S, Gupta AK. (2006). Fluoride in Drinking Water: A Review on the Status and Stress Effects. Critical Reviews in Environmental Science and Technology 36:433–487
“Endemic fluorosis in rural India occurs because of prolonged ingestion of water with excess fluoride (water F > l ppm) resulting in significant skeletal morbidity.”
SOURCE: Tiwari S, et al. (2004). Simultaneous exposure of excess fluoride and calcium deficiency alters VDR, CaR, and calbindin D 9 k mRNA levels in rat duodenal mucosa. Calcified Tissue International 75: 313-20
“High fluoride (> 1.0 mg/L) in drinking water resulted in dental and skeletal fluorosis in local residents (children and pregnant women)… It has been determined that fluoride concentration in excess of 1 mg/L exposes residents to high health risks based on risk identification.”
SOURCE: Bo Z, et al. (2003). Distribution and risk assessment of fluoride in drinking water in the west plain region of Jilin province, China. Environmental Geochemistry and Health 25: 421-31.
“It was initially claimed that crippling fluorosis required water levels of more than 10 ppm before it occurred. More studies, however, have demonstrated that in many populations, crippling occurs above 3 ppm, and can occur at water levels of 1.35- 1.5 ppm, given the presence of predisposing factors.”
SOURCE: Littleton J. (1999). Paleopathology of skeletal fluorosis. American Journal of Physical Anthropology 109: 465-483.
“The lowest fluoride level with skeletal fluorosis and its neurological complications has been reported at 1.2-1.35 ppm.”
SOURCE: Misra UK, et al. (1988). Endemic fluorosis presenting as cervical cord compression. Archives of Environmental Health 43:18-21.
“Confirmed cases of human skeletal fluorosis were reported where, in 6 of 22 communities studied, the fluoride content of drinking water was between 1.2 and 1.9 ppm; whether this represents the sole source of fluoride ingested is not known.”
SOURCE: Marier JR, et al. (1963). Accumulation of skeletal fluoride and its implications. Archives of Environmental Health 664-671.
“At this 1.5 ppm F concentration, 6.1, 6.8, and 9.5% of adults in villages of Banswara, Udaipur, and Dungarpur districts, respectively, showed evidence of skeletal fluorosis.”
SOURCE: Choubisa SL. (2001). Endemic fluorosis in Southern Rajasthan, India. Fluoride 34: 61-70.
“A series of 70 cases of skeletal fluorosis with neurological manifestations was studied… The lowest F concentration in water causing skeletal fluorosis and quadriplegia was 1.35 ppm. Singh et al (1961) recorded spastic paraplegia in a 50 year old male who consumed water containing 1.2 ppm F.”
SOURCE: Siddiqui AH. (1970). Neurological complications of skeletal fluorosis with special reference to lesions in the cervical region. Fluoride 3:91-96.
“This article describes a patient with clinical and radiological features of skeletal fluorosis with neurological sequelae. His problem is of special interest because he lived in a non-tropical, non-endemic area [1 – 2 ppm] where cases of advanced fluorosis would not be expected.”
SOURCE: Maloo JC, et al. (1990). Fluorotic radiculomyelopathy in a Libyan male. Clinical Neurology and Neurosurgery 92: 63-65.
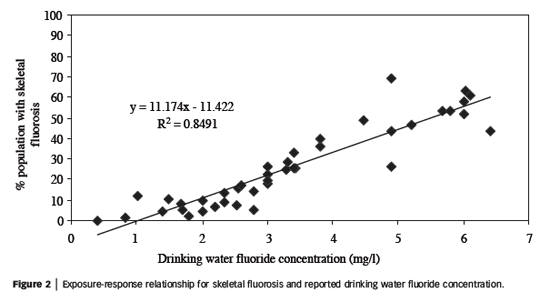
OTHER Figures & Tables

SOURCE: Fewtrell L, et al. (2006). An attempt to estimate the global burden of disease due to fluoride in drinking water. J Water Health. 4(4):533-42.
|
Xu (1997)
|
|||
|
Skeletal Fluorosis
|
|||
|
Fluoride content of water (Villages in Inner Mongolia, China)
|
Individuals Examined
|
Cases
|
% with Skeletal Fluorosis
|
|
0.4
|
1,046
|
0
|
0
|
|
0.65
|
941
|
2
|
0.21
|
|
1.4
|
1204
|
93
|
7.72
|
|
1.6
|
889
|
109
|
12.26
|
|
3.2
|
798
|
101
|
12.66
|
|
3.4
|
866
|
132
|
15.24
|
|
4.7
|
214
|
42
|
19.63
|
|
6.9
|
834
|
166
|
19.9
|
|
SOURCE: Xu RQ, Wu DQ, Xu RY. (1997). Fluoride 30: 26-28.
|
|||
|
Jolly (1973)
|
||
| Village | Water Fluoride (ppm) | Percentage |
| Mandi Baretta | 0.7 | 2.8 |
| Kooriwara | 2.3 | 40.0 |
| Gurnay Kalan | 2.4 | 19.6 |
| Ganza Dhanaula | 4.2 | 26.3 |
| Bajakhana | 5.1 | 46.9 |
| Rajia | 5.2 | 52.2 |
| Village Baretta | 5.5 | 29.6 |
| Rorki | 7.0 | 52.5 |
| Saideke | 8.2 | 52.6 |
| Khara | 9.4 | 80.1 |
| SOURCE: Jolly SS, et al. (1973). Fluoride 6:4-18. | ||
|
Susheela (1993)
|
|||||
|
Skeletal Fluorosis
|
|||||
|
Village
|
Fluoride Content of Water (Mean)
|
Fluoride Content of Water (Range)
|
Individuals Examined
|
Cases
|
% with Skeletal fluorosis
|
|
Bhanakpur
|
1 (ppm)
|
0.7 – 1.6
|
837
|
141
|
16.8%
|
|
Sikrona
|
2.5 (ppm)
|
0.3 – 5.4
|
518
|
94
|
18%
|
|
Karnera
|
3.7 (ppm)
|
0.3 – 7
|
315
|
135
|
42.8%
|
|
Samaypur
|
3.2 (ppm)
|
0.25 – 8
|
288
|
163
|
58.6%
|
|
SOURCE: Susheela AK, Kumar A, Bhatnagar M, Bahadur R. (1993). Fluoride 26: 97-104.
|
|||||
Mean


