Research Studies
Study Tracker
The association of fluoride exposure with bone density and fracture risk: a dose-response meta-analysis.Abstract
FULL-TEXT STUDY ONLINE AT
https://ehjournal.biomedcentral.com/articles/10.1186/s12940-025-01226-y
Background
Fluoride exposure and its effects on human health are controversial and highly debated. While beneficial in preventing dental caries, fluoride has been linked to skeletal and dental fluorosis at high levels, as well as other adverse health endpoints in children and adults. However, the safe range of exposure for bone health remains poorly defined. We used existing literature to quantify the dose-response relation between fluoride exposure and bone health, focusing on fracture risk and bone mineral density (BMD).
Methods
We conducted a systematic review and dose-response meta-analysis by searching literature in online databases (MEDLINE/PubMed, Embase and Web of Science) up to August 26, 2025, and by pooling results of studies examining fluoride exposure and its associations with bone health outcomes, namely fracture risk and BMD. We also conducted stratified analyses by sex, age, and fracture site. This study is registered in PROSPERO (CRD42022321899).
Results
We included 37 studies published between 1945 and 2024. 10 pertained to bone density only; 19 to bone fractures only; and eight to both outcomes. We found a non-linear, positive relation between fluoride exposure and fracture risk, with an indication of an approximate threshold around 1.5 mg/L of fluoride in drinking water and a nearly linear increasing fracture risk above that concentration (risk ratios of 1.06, 1.19 and 1.35 at 2.0, 3.0 and 4.0 mg/L, respectively, compared to null exposure). Sex-specific dose-response analyses, available only for fragility fractures, indicated an effect in females but little or nothing in males. The association between fluoride and BMD was inconsistent, showing opposite trends for different bone sites (hip and spine) and amounts of exposure, and by sex. Among females aged over 50 years, an association of drinking water fluoride with fragility fracture risk started as early as around 0.5 mg/L (risk ratio of 1.26 at 1.0 mg/L).
Conclusions
This study indicates increased risk of fractures with fluoride exposure?>?1.5 mg/L in drinking water, with an enhanced susceptibility in postmenopausal females. These findings, which appear consistent with those yielded by recent pooled analysis related to other endpoints in children, may be helpful in assessing the risk-benefit profile for fluoride exposure.
Clinical trial registration not applicable.
Background
Bone health is important to both quality of life and independence. Risk of fracture increases with age, along with low bone mineral density, osteopenia and osteoporosis [1]. One of the many environmental factors influencing bone health is fluoride (F), a widespread halogen commonly found in drinking water, but also in diet and dietary supplements, toothpaste, mouthwash, and ambient air [2]. Soil and groundwater fluoride content may be considerably affected by anthropogenic activities [3].
Drinking water is the most abundant source of fluoride for many individuals and populations [2, 4]. Fluoride is added to municipal water supplies in many areas, at concentrations ranging from 0.7 to 1.2 mg/L. The guideline in the USA was lowered to 0.7 mg/L in 2015 [5]. Fluoride from most dietary sources and drinking water is rapidly absorbed into the bloodstream, and deposited in calcified tissues, predominantly in bone and dental enamel [6]. Topical application of fluoride, through fluoride-containing dental products such as toothpaste and mouthrinse, and by direct application of a concentrated solution, is an alternative method of delivering fluoride to tooth enamel, and can be effective for dental caries prevention [2, 7].
Although water fluoridation has long been advocated for oral health promotion, evidence regarding caries prevention is still debated [2, 7, 8], with a recent review finding little benefit of community water fluoridation in caries prevention after the introduction of fluoridated toothpaste [9]. A number of adverse health issues due to excess fluoride intake, particularly in areas with high levels of fluoride in drinking water, have been documented or suspected [2, 4, 10,11,12,13,14]. They include altered cognitive neurodevelopment [11, 14, 15], dental and skeletal fluorosis [13], impaired thyroid function [10], altered bone mineral density and increased risk of fractures [16]. However, the occurrence of such effects and the levels of exposure involved have been debated [17], particularly for the neurodevelopmental effects [2, 12, 18,19,20,21,22,23]. Given the absence of any dose-response analysis on fluoride and bone health, we conducted a meta-analysis to assess the overall relation between fluoride exposure and bone health, focusing on potential critical thresholds.
Methods
Study protocol and registration
We registered the protocol of this systematic review in the PROSPERO database (registration no. CRD42022321899) and carried it out according to the Preferred Reporting Items for Systematic Reviews and Meta-Analysis (PRISMA) 2020 guidelines [24].
Search strategy and study selection
We conducted two independent comprehensive literature searches according to the PECOS criteria (population, exposure, comparison, outcome, study type) [25], driven by the questions: “What is the effect of fluoride exposure on bone strength and density? and “What is the effect of fluoride exposure on risk of fractures?“. We included all studies with: (P) substantially healthy population of any age; (E) assessment of long-term fluoride exposure by determination of drinking water fluoride content or dietary intake and/or using biomarkers of exposure; (C) reporting of health indicators within two or more categories of fluoride exposure; (O) assessment indicators of bone density or strength (e.g., bone mineral density-BMD, bone mineral content-BMC), and/or diagnosis of bone fractures; (S) any study type, including trial, cohort or case-control study. When multiple studies examined the same population, we included only the most complete one (e.g. with the longest follow-up).
To find the eligible studies, we searched the PubMed/MEDLINE, Embase, and Web of Science databases from inception up to August 26, 2025, using MeSH terms and keywords linked to “bone”, “density”, “fracture” and “fluoride” (Supplementary Table S1), deleting duplicate studies. Three authors (RM, II, LDP) independently screened titles, abstracts, and full texts of the retrieved studies to exclude those that did not meet the eligibility criteria. Any disagreements were resolved by the intervention of two other authors (TF and MV), or until a consensus was reached. Additionally, we checked the reference lists of included studies and previous reviews, and employed backward and forward citation retrieval techniques to identify potentially relevant additional articles [26].
We included studies reporting different types of effect and risk measures, such as relative risk (RR), hazard ratio (HR), odds ratio (OR), or mean difference (MD), along with the corresponding 95% confidence interval (95% CI), standard error (SE), standard deviation (SD), or interquartile range (IQR), or data to calculate them as per Cochrane Handbook for Systematic Reviews of Interventions [27]. This included calculating standard errors from reported confidence intervals, converting interquartile ranges to standard deviations using established conversions (e.g., SD?=?IQR/1.35), and estimating standard deviations from p-values using standard normal approximations when applicable. We did not apply statistical transformations to convert between effect estimates, which were pooled only when directly comparable.
Data extraction
Three authors (RM, II, LDP) independently conducted data extraction from the selected articles, with a fourth author (TF) verifying the process. We employed two distinct standardized spreadsheets for collecting data relating to the two outcomes. For each article, we compiled the following details: (1) the first author’s name; (2) study details (title, publication year, study design, country); (3) population characteristics (sex, age, sample size); (4) exposure characteristics (definition, assessment method, categories of exposure); (5) outcome (definition, assessment method, number of cases); (6) effect estimates (RRs, HRs, ORs, MDs) with their 95% CIs, SE, SD from the most adjusted model; (7) potential confounders accounted for in the multivariable analysis.
Risk of bias assessment
Three authors (RM, II, LDP) independently assessed the risk of bias (RoB) of the included studies based on the Risk of Bias for Non-randomized Studies of Exposures (ROBINS-E) criteria [28]. Any discrepancies were resolved with input from two other authors (MV and TF). We categorized the studies into low, moderate, or high risk of bias based on seven domains: (1) confounding bias; (2) participant selection bias; (3) exposure classification bias; (4) departures from intended exposures bias; (5) missing data bias; (6) outcome measurement bias; and (7) bias in the selection of reported results. In (Supplementary Table S2), we detailed the criteria for risk of bias evaluation. We deemed a study to have a moderate or high risk of bias if at least one domain was judged as moderate or high risk, respectively; else, it was classified as having a low risk of bias.
Data analysis
We quantitatively compared fracture risks and BMD values across varying levels of fluoride exposure using a restricted maximum likelihood random-effects model [29]. Additionally, we conducted a dose-response meta-analysis to assess bone fracture risk and BMD with increasing fluoride exposure, based on the one-stage approach [30], a methodology recently applied to pool epidemiologic data and characterize the dose-response relationship across the entire range of exposure [31,32,33,34]. Where mean or median values were unavailable for levels of exposure in open-ended categories, we estimated values 20% higher or lower than the nearest cut-point [35]. To allow for non-linear relationships, we used a restricted cubic spline model with three knots at fixed percentiles (10th, 50th, and 90th) of fluoride exposure. We assessed heterogeneity of included studies using the
statistics evaluating the between-study heterogeneity relative to the variance of the pooled random-effects estimate [36] and through variation of study-specific curves evaluating the variability across individual studies [29, 37]. We conducted funnel plot analyses and Egger’s regression tests wherever sufficient data were available.
In the aggregate BMD analyses, when multiple measurements from different subregions of the hip were reported within a single study (e.g., femoral neck, Ward’s triangle, trochanter), we selected only one to include in the meta-analysis to avoid multiple correlated estimates from the same anatomical region. To ensure consistency and comparability across studies, we applied a predefined hierarchy of hip subregions based on the relative frequency of reporting across studies, prioritizing them in the following order: hip or femur, femoral neck, Ward’s triangle, trochanter, inter-trochanter. When more than one site was reported within a study, we included only the highest-priority site according to this hierarchy.
Whenever possible, we carried out stratified analyses separately for different levels of variables that might modify the effect measure, such as sex and age. We also carried out sensitivity analyses by excluding studies at high risk of bias. Additionally, we examined fragility fractures in females over 50, the average age of menopause onset [38], to assess how menopause and fluoride exposure jointly affect bone health. We used Stata software (v18.0, Stata Corp., College Station, TX, 2023) for all data analyses.
Results
Study selection and characteristics of the included studies
The detailed literature databases search and study selection process are in the PRISMA flowchart (Fig. 1). Regarding bone strength and density, we initially identified a total of 1257 articles. Following duplicate removal, 1049 articles remained, from which 1010 records were excluded after title and abstract assessment as they were considered not relevant or they were not written in English. After these exclusions, there were 39 articles remaining for full-text evaluation. We made additional exclusions after full-text review, excluding an additional total of 22 studies. Details on reasons for exclusion are provided in (Supplementary Table S3).
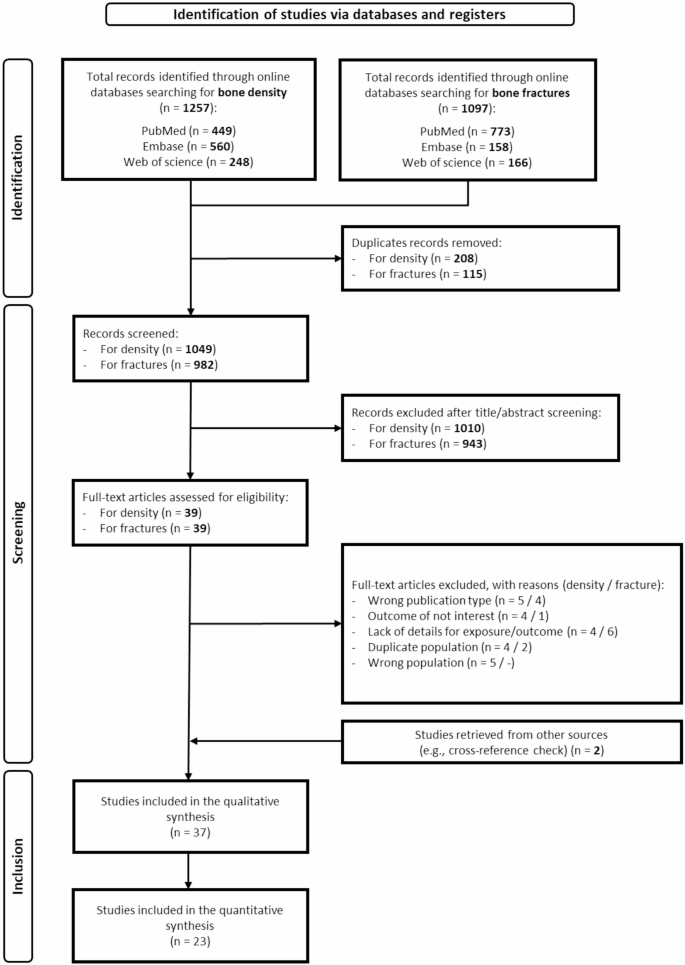
PRISMA flowchart for study identification and inclusion. Studies included in the qualitative synthesis [16, 39,40,41,42,43,44,45,46,47,48,49,50,51,52,53,54,55,56,57,58,59,60,61,62,63,64,65,66,67,68,69,70,71,72,73,74]/studies included in the quantitative synthesis [39,40,41, 43, 45, 48,49,50,51,52, 54, 55, 57,58,59, 61, 63,64,65, 68, 69, 72, 73]
We applied the same selection process to assess fracture risk, initially identifying a total of 1097 articles before removing duplicates, and 982 articles afterward. Among these, 943 were excluded after screening titles and abstracts, as they were deemed unsuitable publication types, irrelevant to the outcomes, or non-English studies. Out of the 39 articles we assessed in full text, 13 were subsequently excluded. The articles excluded after full-text review, along with the reasons for their exclusion, are listed in (Supplementary Table S3). Furthermore, we retrieved one article regarding bone fractures and one article on whole-body BMD through citation chasing [39].
Ultimately, 37 studies were included in our meta-analysis and deemed suitable to assess the association between fluoride exposure and bone health: 10 pertaining to bone density only [40,41,42,43,44,45,46,47,48]; 19 on bone fractures only [39, 49,50,51,52,53,54,55,56,57,58,59,60,61,62,63,64,65,66]; and eight on both outcomes [16, 67,68,69,70,71,72,73].
Characteristics of the included studies
The details of the 37 studies included are summarized in Table 1. Regarding the year of publication: three studies were conducted before 1980 [39, 54, 58], three were carried out in the 1980?s [40, 49, 64], the majority, 18, were published between 1990 and 1999 [41, 43, 45,46,47,48, 50,51,52,53, 56, 57, 59, 65, 67,68,69, 72], eight were published between 2000 and 2019 [42, 55, 61, 63, 66, 70, 71, 73], and five were published after 2020 [16, 44, 60, 62, 74].
The majority of studies focused on North American populations, with 16 being from the USA [39, 47, 48, 51, 53, 54, 56,57,58, 62, 67, 70,71,72,73,74] and two from Canada [41, 65]. The second most represented population was Northern Europe, with five studies from Finland [40, 49, 59, 64, 68] and three from Sweden [16, 46, 63]. Additionally, there were three studies from the UK [50, 55, 66], one from Poland [43], one from Italy [52], and one from Germany [75]. From Asia, two studies were included from China [42, 61], one from Taiwan [45], and one from South Korea [60]. Only one study originated from Africa, specifically from Ethiopia [44].
Sixteen studies had an ecological design [39, 43, 46, 49,50,51,52, 54, 56,57,58, 60, 61, 63,64,65], 12 a cohort design [16, 40, 41, 47, 48, 53, 59, 67, 70,71,72, 74], nine cross-sectional [42, 44, 45, 62, 66, 68, 69, 73, 74], with one being interventional [42], one a population-based case-control design [55]. Exposure was predominantly assessed by measuring fluoride drinking water content [39,40,41,42,43,44,45,46,47,48,49,50, 52, 54, 55, 57,58,59,60,61,62,63,64,65,66,67,68,69, 71,72,73,74] reported either in mg/L or ppm, which are numerically equivalent and directly comparable. Urinary fluoride content was expressed either as mg/L [42, 43, 74] or mg/g creatinine [16]. Dietary or daily fluoride intake was expressed as mg/day by two studies [16, 70]. One study assessed fluoride content in serum [73], one in plasma [74], one in hair [43]. and one in toenails [53]. These alternative biomarkers were not integrated into pooled analyses, as exposure-response synthesis was only performed for studies using directly compatible exposure metrics.
Concerning outcomes, bone strength studies assessed BMD [16, 40,41,42,43, 45,46,47,48, 67,68,69,70,71,72,73,74], BMC [47, 70], bone compressive strength [40], bone width [47], and speed of sound [44]. Regarding bone density or strength, the investigated locations were lumbar spine or spine [16, 41, 43, 45, 48, 67,68,69,70,71, 73], hip and femur [16, 40, 43, 67,68,69,70,71,72,73], radius, tibia and forearm [44, 47, 48, 67, 71,72,73, 76], calcaneus [67, 71], tibia and phalanx [44], and whole-body [41, 46, 70, 74].
Risk of fractures was assessed with reference to arm, humerus, elbow and wrist [39, 52, 57, 58, 62, 67, 68, 71, 72], leg, knee and ankle [39, 57, 68, 72], hip and femur [16, 49,50,51,52,53,54,55,56,57,58,59, 61,62,63,64,65,66,67, 69, 71] vertebral [52, 67, 71], and nose [52]. Each study was categorized according to the most specific anatomical location it reported (i.e., if a study included both “arm fractures” and “humerus fractures”, we only considered the latter). Some studies used broader endpoints such as “all fractures” [39, 60, 61, 68, 70, 72], “all non-vertebral fractures” [71], and “osteoporotic” and “non-osteoporotic fractures” [73].
Risk of bias assessment
We provide details about study quality (Supplementary Table S4). Regarding bone density and strength, we deemed nine of the included studies to have overall “high” risk of bias [40, 43, 46, 47, 69,70,71, 76], five at “moderate” risk [41, 48, 67, 68, 72], and four at “low” risk [16, 44, 45, 73].
Considering bone fractures, we judged 18 of the included studies at “high” risk of bias for this outcome [39, 49, 50, 52, 54, 56,57,58, 60, 62, 64,65,66, 68,69,70,71,72], seven at “moderate” risk of bias [51, 53, 55, 59, 61, 63, 67], and two at “low” risk of bias [16, 73].
Regardless of the outcome, the main factors contributing to the high-risk rating included unaccounted sources of confounding (n?=?11) and bias in exposure measurement (n?=?8).
Dose-response meta-analysis on risk of fractures
Four studies [39, 61, 68, 72] assessed the overall risk ratio of fractures, regardless of the site. Figure 2 illustrates the dose-response curve and the threshold effect for all fractures risk in relation to fluoride exposure, in the overall study populations since no sex-specific analysis was feasible. At low levels of fluoride, specifically up to around 1.4 mg/L, there was no change in fracture risk (RR 1.00 at 1.2 mg/L; 95% CI 0.80–1.24). Above 1.4 mg/L, as fluoride concentrations increased, the risk of fracture gradually increased, with a RR of 1.06 (95% CI 0.80–1.41) at 2.0 mg/L, increasing to 1.19 (95% CI 0.87–1.64) at 3.0 mg/L, and to 1.35 (95% CI 0.94–1.95) at 4.0 mg/L. Study specific curves strongly support a consistent positive association between fluoride exposure and fracture risk across studies, with the only exception of one investigation of teen-age males aged 15–17 [39] (Supplementary Figure S1).
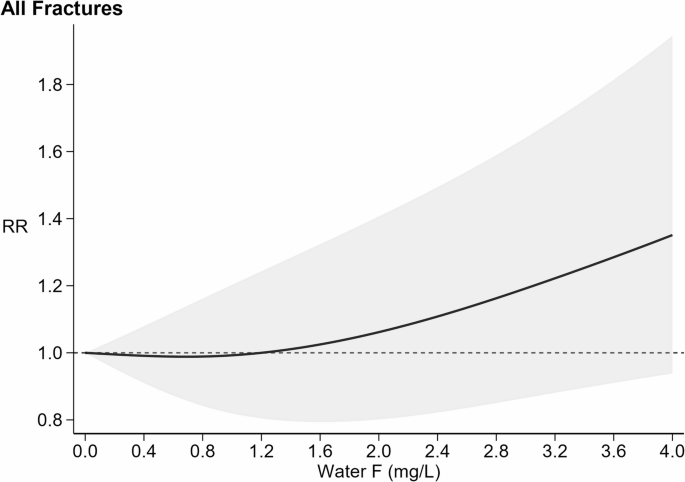
=15%). Fracture risk curve (black solid line) with 95% confidence interval (grey area). RR: risk ratio with reference at 1.0 (dash line)
Dose-response meta-analysis on risk of fragility fractures
Dose-response analysis of fragility fractures also revealed a non-linear relation (Fig. 3), with a slight indication of a U-shaped dose-response pattern. The corresponding RRs were 0.93 (95% CI 0.84–1.02) for water fluoride concentrations up to 0.9 mg/L, 1.00 (95% CI 0.82–1.21) at 1.48 mg/L, and 1.05 (95% CI 0.82–1.35) at 1.8 mg/L. In the sex-specific analysis, there was a clear evidence of a U-shaped curve only in females, with the lowest risk around 0.4 mg/L and a monotonic increase above 0.9 mg/L. Specifically, the RR was 0.84 (95% CI 0.67–1.07) at 0.34 mg/L, 1.00 (95% 0.79–1.27) at 0.9 mg/L, and rose to 1.13 (95% CI 0.93–1.37) at 1.1 mg/L. In contrast, the curve for males (seven studies) was generally indicative of a decreased risk with increasing fluoride exposure with Little indication of a U-shaped pattern, and RR ranging from 0.83 (95% CI 0.72–0.97) at 0.57 mg/L to 0.87 (95% CI 0.48–1.58) at 1.8 mg/L.
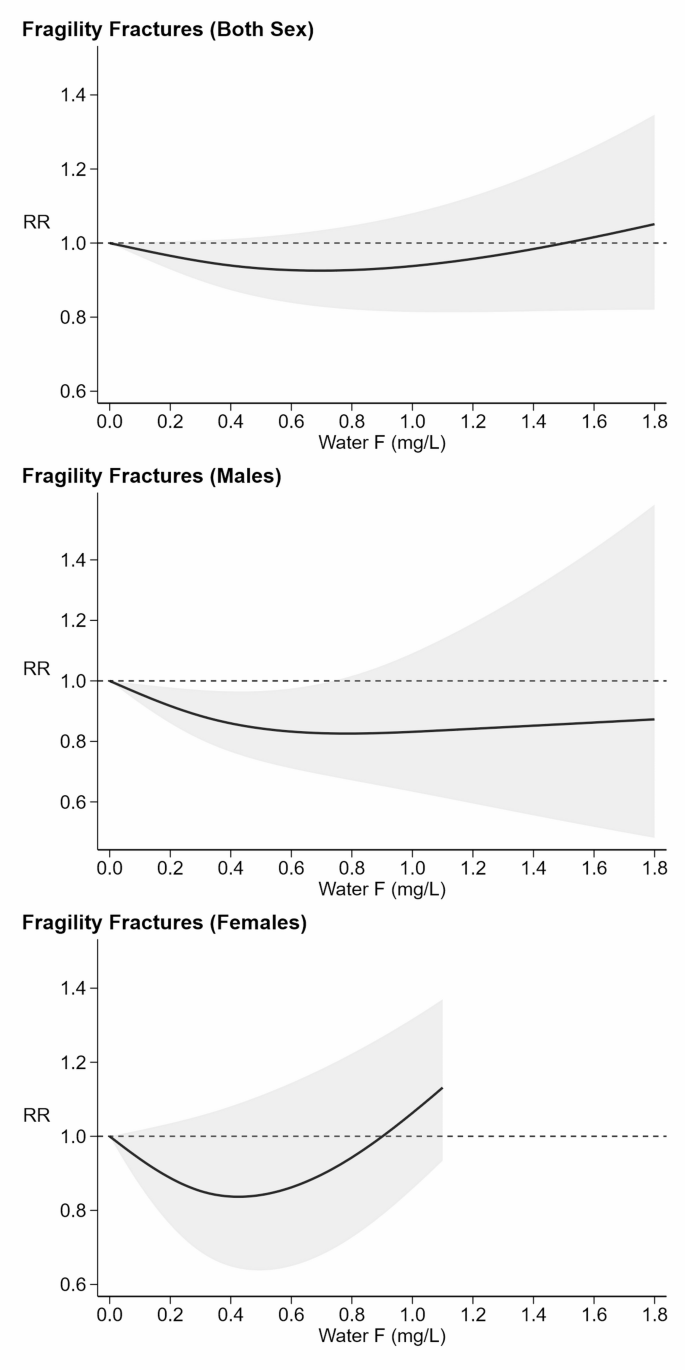
Dose-response meta-analysis of fragility fracture (those that occur in districts such as hip, wrist, femur, and spine) risk and exposure to fluoride (F) from water, stratified by sex. Six studies [49, 50, 55, 61, 63, 65] analyzed the risk of fractures typically classified as fragility fractures in both sexes (
=35%). Eight studies [50,51,52, 58, 59, 64, 65, 69] considered fragility fractures in males (=91%). Additionally, six studies [50, 54, 58, 68, 69, 73] evaluated this risk in females (
=17%). Fracture risk curve (black solid line) with 95% confidence interval (grey area). RR: risk ratio with reference at 1.0 (dash line)
The study-specific curves for fragility fractures are depicted in (Supplementary Figure S2). In females, the individual curves tend to follow a similar pattern: a downward slope in RR at low fluoride levels (0.1–0.5 mg/L) followed by an upward turn as fluoride concentration increased, exceeding 1 beyond 1.0 mg/L. Above this level, most of the studies show an increase in risk, but two showed a flat dose-response curve, and only one displayed a consistent decline in risk. The same trend emerged in females, with most studies showing a U-shaped trend with minimum risk between 0.2 and 0.6 mg/L. On the other hand, Studies restricted to males showed very inconsistent patterns, i.e. an increase in risk above 0.6 mg/L, a flat dose-response curve, and a consistent decline in risk.
Dose-response meta-analysis on site-specific risk of fractures
Figure 4 shows the dose-responses curves for fractures typically associated with fragility, namely at the hip, femur, and wrist. For hip fractures, the curve indicated Little association and was nearly flat, with a comparatively narrow 95% confidence band. For femoral fractures, the curve was mildly U-shaped, with the RR showing decreasing risk of fracture as fluoride levels increased from zero to about 0.5 mg/L, with a RR of 0.86 (95% CI 0.71–1.05) at this point. Above 0.5 mg/L, however, the risk rose slightly with increasing fluoride exposure, reaching an RR of 1.06 (95% CI 0.67–1.69) at 1.8 mg/L. Throughout most of the range of fluoride exposure, the risk for femoral fracture was lower than the risk for those with no exposure to fluoride. For wrist fractures, risk declined monotonically and nearly Linearly as fluoride exposure changed from zero to the highest levels. Specifically, the RR began at 1.00 (95% CI 0.99–1.01) at 0.01 mg/L and gradually declined to 0.84 (95% CI 0.43–1.65) at 1.5 mg/L. The study-specific curves for each exposure stratum are shown in (Supplementary Figure S3), indicating a high degree of variability between studies assessing risk of hip and femoral fractures across all levels of fluoride. Wrist fracture risk patterns showed a RR around 1.0 up to levels of water fluoride of 0.6 mg/L, where half of the studies started to exhibit an increase in risk, and the other half a decreased risk.
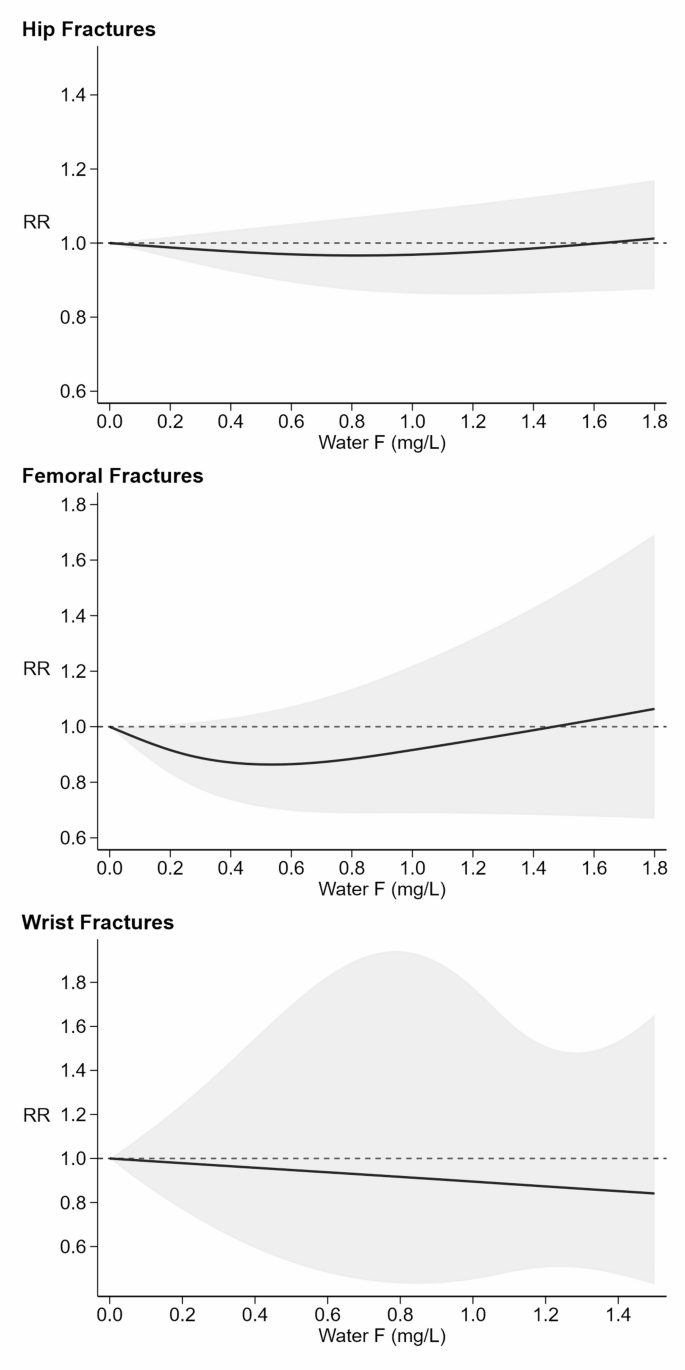
=9%). Six studies [50,51,52, 54, 64, 69] examined the risk for femoral fractures (=76%). Four studies [52, 58, 68, 72] focused specifically on wrist fractures (
=90%). Fracture risk curve (black solid line) with 95% confidence interval (grey area). RR: risk ratio with reference at 1.0 (dash line)
Dose-response meta-analysis on BMD
The relation between fluoride exposure from water and BMD, including data stratified by sex (both sexes and females) and site (hip or spine), is shown in Fig. 5. While hip BMD increase in both sexes, though linearly in males and non-linearly (starting above 1.2 mg/L) in females, for spine BMD there was an indication of an inverted U-shaped association both in males and in females, the highest value being around 0.6 mg/L. In (Supplementary Figure S4), curves for hip and spine BMD MD are reported though females only due to insufficient data in males; these show a monotonic upward trend with increasing fluoride for hip BMD, starting above 1.2 mg/L of fluoride, whereas no change emerged for spine BMD, with a high heterogeneity as far as study specific curves in both sexes were concerned (Supplementary Figure S5).
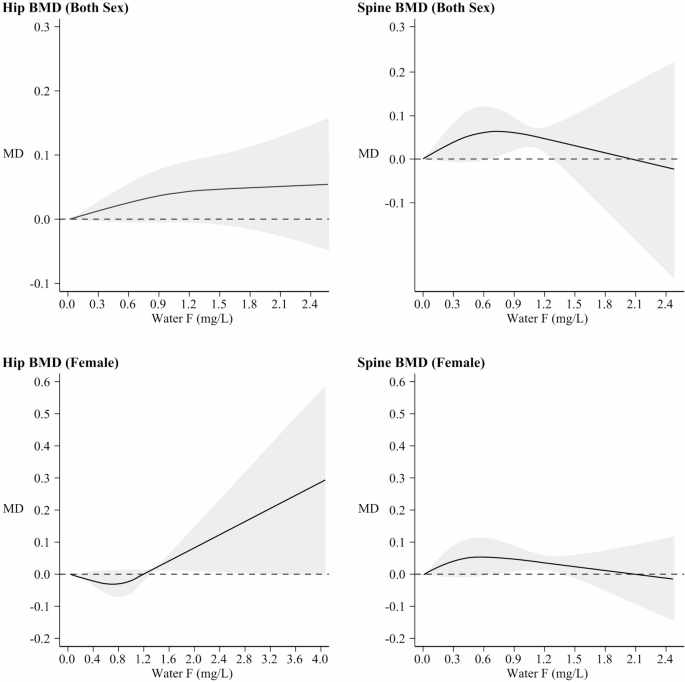
Dose-response meta-analysis of bone mineral density (BMD) and exposure to fluoride (F) from water, stratified by site and sex (both sex and female). Seven studies [40, 41, 43, 48, 68, 69, 72] assessed hip BMD (=58%), and six studies [41, 43, 45, 48, 68, 69] for spine BMD (=96%), in both males and females. Additionally, six studies [40, 41, 48, 68, 69, 72] focused on hip BMD (=95%), and five studies [41, 45, 48, 68, 69] on spine BMD (
=64%), in females only. Mean Difference BMD curve (black solid line) with 95% confidence interval (grey area). MD: mean difference with baseline at 0.0 (dashed line)
Sensitivity analyses on risk of fractures and fragility fractures
Regarding fracture risk in females over 50 years of age (Supplementary Figure S6), the curve exhibited a steep upward trend, with the lowest risk around 0.25 mg/L and a sharp increase in fracture risk starting at around 0.5 mg/L. Specifically, the RR was 0.98 (95% CI 0.83–1.14) at 0.25 mg/L, 1.00 (95% 0.80–1.24) at 0.45 mg/L, and 1.26 (95% CI 1.10–1.46) at 1.0 mg/L. For this analysis, (Supplementary Figure S7) provides the funnel plot and Egger’s test (slope: 1.72, 95% CI 0.19–3.62) indicating a largely symmetrical distribution and Little evidence of publication bias. Concerning BMD, a dose-response analysis in females over 50 was only possible for spine BMD, with an indication of an inverted U-shaped curve with a downward trend starting at a lower F concentrations than in the overall analysis (Supplementary Figure S8). There was some asymmetry in the published data, but not strong evidence of publication bias (Supplementary Figure S9).
Several studies [16, 48, 53, 55, 67, 68, 71, 73] adjusted the results depending on menopause onset and/or hormone replacement therapy use, another important factor in bone health status in females [77]. We had insufficient data, however, to report on this group of studies by themselves.
Concerning the effect of study quality on the pattern of associations, a subgroup analysis excluding the studies at higher risk of bias could be conducted only for a few endpoints, and not for the main analysis concerning risk of all fractures. Regarding overall RR of fragility fractures (Supplementary Figure S10), the RR decreased to 0.93 (95% CI 0.72–1.21) at fluoride exposure in the 0.8–1.5 mg/L range; it was 0.95 (95% CI 0.70–1.29) at 1.8 mg/L, with inconsistencies across the few studies available. In the analysis of hip fracture risk across all sexes after exclusion of studies at high risk of bias (Supplementary Figure S11), there was little change in the RR across the entire range of exposure, again with notable variation between studies: some studies clearly indicated a decrease in risk, while others showed a consistent increase as fluoride levels rise.
Sensitivity analyses on BMD
BMD outcomes for females, specifically for the hip and spine, restricted to studies with low-to-moderate risk of bias, are shown in (Supplementary Figure S12). Regarding hip BMD, the MD curve remained stable up to around 0.9 mg/L, after which a monotonic and almost Linear upward trend emerged. Specifically, MD increased to 0.04 g/cm2 (95% CI ?0.03?0.12) up to around 2.3 mg/L, reaching 0.09 g/cm2 (95% CI ?0.09; 0.27) at 4.0 mg/L. Study-specific curves consistently mirrored this pattern. For spine BMD, an initial rise leveled off at around 0.5 mg/L, with MD values of 0.02 g/cm2 (95% CI ?0.02; 0.07) at 0.20 mg/L and 0.06 g/cm2 (95% CI ?0.01; 0.12) from 0.7 to 2.35 mg/L, peaking at 0.07 g/cm2 (95% CI 0.11; 0.24) above. Study-specific curves displayed variable shape, in one study peaking between 0.4 and 0.8 mg/L before declining at higher exposure, while others follow the general pattern of the pooled analysis.
(Supplementary Figure S13) illustrates BMD for both sexes, after excluding studies at high risk of bias. For hip BMD no relation with fluoride exposure emerged, with curves of the single studies generally aligning with this pattern. For spine BMD, there was little evidence of a relation with water fluoride concentrations: the curve initially rose to a MD of 0.06 g/cm2 (95% CI ?0.02; 0.13) around fluoride levels of 0.60 mg/L. However, as fluoride levels increased beyond 1.27 mg/L, the Line flattened at a 0.05 g/cm2 (95% CI 0.01; 0.10) until 2.27 mg/L, followed by a slight decrease to 0.04 g/cm2 (95% CI ?0.21; 0.30) after this point. Results of individual studies were very inconsistent, showing discordant trends at increasing fluoride exposure.
Discussion
By pooling results from previously published studies across all the exposure levels investigated, we could model and characterize the dose-response pattern of fluoride exposure with bone thickness and fracture risk. We found evidence for a positive dose-response relation with fracture risk for doses exceeding a threshold that is close to the current WHO guideline value of 1.5 mg/L of drinking water fluoride. Previous reviews and meta-analyses did not consider the dose-response curve across the full range of fluoride exposure [78,79,80,81,82], concluding that while low and moderate fluoride exposures seem to have limited effects on fracture risk and can increase bone mass in some cases. The larger number of studies available for this review and the pooling of exposure-specific effect estimates allowed us to assess the relation between fluoride and bone quality quantitatively across the range of exposure characterizing the general population.
Our data indicated little relation between fluoride exposure and overall fracture risk below 1.5 mg/L of drinking water fluoride, with fracture risk starting to increase gradually above that threshold. The threshold level corresponds to around 3-3.5 mg/day of exposure from this source (assuming a water consumption of 2 L/day and little contribution of fluoride from other sources) [83, 84]. In several of our pooled analyses, some types of fractures showed a U-shaped pattern, with risk of fracture decreasing with increasing fluoride exposure from zero to moderate levels of exposure, but increasing as exposure increased from moderate to high levels of fluoride exposure. Such a pattern might be an artifact due to the more limited number of studies on which such analyses were based, and a related higher uncertainty and statistical instability, especially in view of the small changes in RR involved. Nonetheless, the hypothesis that exposure to drinking water fluoride around 0.5–0.6 mg/L might have beneficial effects on fracture risk (compared with no exposure), at least on some specific fracture subsets, is consistent with our findings. We also note the inconsistencies between the findings for site-specific fractures (hip, wrist and femur), with different patterns of association, that mirror the inconsistencies found in the BMD analyses for hip and spine. Such inconsistencies may be due to the limited number of studies for these endpoints, or to real differences of the fluoride effects on specific bone districts. Bone composition might also play a role, as wrist is primarily composed of cortical bone while spine is predominantly trabecular bone, which is more metabolically active and responsive to agents that stimulate bone formation [85]. Interestingly, similar dose-response patterns and approximate thresholds have been observed in pooled analyses of fluoride exposure and two key health endpoints, IQ and thyroid function in children [10, 14].
Among females over 50 years, who are at notably higher fracture risk than younger subjects [86, 87], there was a stronger correlation between fluoride exposure and fragility fracture risk, starting at fluoride concentrations around 0.5 mg/L. Furthermore, the decline in spine BMD was slightly stronger in females aged 50 years or over, and the decline began at lower fluoride drinking water levels, compared with all females. Although these findings are based on a limited number of studies, the protective role of estrogen in bone health is well established [88, 89], and it is also widely recognized that postmenopausal females are particularly vulnerable to osteoporosis and fragility fractures [90]. Menopause accelerates bone loss by increasing bone resorption at a rate that surpasses bone formation, both directly [91]. and indirectly [92]. The steep upward trend in fragility fracture risk in females?>?50 years of age may reflect long-term continuous exposure to fluoride in drinking water or increased release of fluoride from bone stores. This possibility underscores the importance of cumulative exposure in a “potentially exposed or susceptible subpopulations,” according to EPA Toxic Substances Control Act [93]. Although our analysis stratified by age (i.e. females over 50) rather than confirmed menopause status, age likely serves as a reasonable proxy for menopausal status in this analysis. The possibility of a negative effect of fluoride exposure, assessed through water and plasma fluoride concentrations, on sex steroid hormones including estradiol is supported by the limited epidemiologic and toxicological evidence available, and post-menopausal fluoride release from bone post menopause could contribute to such adverse effects [10, 94,95,96].
Helte et al. reported an adverse effect of fluoride exposure on all fractures and hip fractures in a cohort study of postmenopausal Swedish females, which we could not include in our analysis because it was based on a urinary biomarker and on overall dietary exposure [16]. In that study, an excess risk for all fractures was apparent among those with urinary fluoride levels in the highest tertile even in an area with relatively low water fluoride concentration (??1 mg/L) [16].
We could conduct this quantitative dose-response pooled analysis only for fluoride exposure in drinking water, and not from other sources, due to the limited number of studies investigating exposure biomarkers or directly assessing dietary intake. Unfortunately, most studies investigating risks associated with water fluoride content did not consider total fluoride exposure and particularly that from two major sources of dietary intake, tea and fluoridated salt, increasing the uncertainty inherent in the overall exposure assessment.Nonetheless, drinking water is generally the major source of fluoride intake even when its fluoride content is low (i.e. ? 1 mg/L) [2, 16, 97,98,99], therefore justifying an exposure assessment based on this indicator [10, 12,13,14]. Furthermore, there is evidence that exposure assessment based on biomarkers, although capturing additional sources of fluoride beyond drinking water, is limited by the short half-life of fluoride (around 6-hours), thus detracting from the utility of biomarkers compared with a long-term stable indicator of exposure such as drinking water fluoride content [100, 101]. Finally, the observational design of the studies relied upon here might be conducive to residual confounding, though the studies that were included generally attempted to control most relevant confounders.
The additional bone health indicator we assessed, BMD, refers to bone quality and is generally considered a key indicator of bone strength and a standard for clinical assessment, being used as the measure to predict fracture risk and assess responses to interventions [102]. The results for the association between fluoride and BMD were not consistent, and they also did not correspond to the pattern observed for fractures, raising the question about the usefulness of this endpoint. BMD only measures bone density, without providing information on bone morphology, architecture, tissue properties, or susceptibility to fracture [103,104,105,106]. Therefore, BMD does not provide a full picture of bone health and does not necessarily predict fracture risk, which is a direct outcome reflecting overall bone strength and health [107]. The hypothesis that a fluoride-induced increase in BMD could coexist with an increased fracture risk due to an inherently lower bone ‘quality’ should not be dismissed [108]. Heterogeneity across imaging methods and populations could also contribute to this discrepancy, but again BMD only captures bone quantity (density), not bone quality (e.g., architecture, morphology, microdamage, material properties). The latter aspects of bone health are crucial determinants of fracture risk. The association between fluoride exposure and hip BMD were similar in our dose-response meta-analysis and the above mentioned Swedish study [16], whereas spine BMD was not investigated in the latter.
Conclusions
Overall, our findings about the effects of fluoride exposure on fracture risk, assessed through drinking water concentrations, indicate a non-linear, positive dose-dependent relation, with an indication of a U-shaped association with fragility fractures. The association with BMD was less consistent. We also found evidence for an enhanced susceptibility of postmenopausal females to the adverse effects of fluoride on fracture risk. The observed effects that begin near regulatory thresholds and extend into high levels of fluoride exposure may be important to consider in shaping any public health policy that attempts to balance risks against benefits of fluoride exposure.
Data availability
Data in this systematic review and meta-analysis are extracted from published studies available elsewhere. All processed data are presented in this article and the supplementary material.
Abbreviations
- BMC:
- Bone mineral content
- BMD:
- Bone mineral density
- CI:
- Confidence interval
- HR:
- Hazard ratio
- IQR:
- Interquartile range
- MD:
- Mean difference
- OR:
- Odds ratio
- PRISMA:
- Preferred reporting items for systematic reviews and meta-analysis
- ROBINS-E:
- Risk of bias for non-randomized studies of exposures
- RR:
- Relative risk
- SD:
- Standard deviation
- SE:
- Standard error
References
-
Reid IR, McClung MR. Osteopenia: a key target for fracture prevention. Lancet Diabetes Endocrinol. 2024;12(11):856–64. https://doi.org/10.1016/S2213-8587(24)00225-0.
-
Till C, Grandjean P, Martinez-Mier EA, Hu H, Lanphear B. Health risks and benefits of fluoride exposure during pregnancy and infancy. Annu Rev Public Health. 2025;46(1):253–74. https://doi.org/10.1146/annurev-publhealth-060722-023526.
-
Wang M, Wang H, Lei G, Yang B, Hu T, Ye Y, Li W, Zhou Y, Yang X, Xu H. Current progress on fluoride occurrence in the soil environment: sources, transformation, regulations and remediation. Chemosphere. 2023;341:139901. https://doi.org/10.1016/j.chemosphere.2023.139901.
-
Scientific Committee EFSA, Bennekou SH, Allende A, Bearth A, Casacuberta J, Castle L, et al. Updated consumer risk assessment of fluoride in food and drinking water including the contribution from other sources of oral exposure. EFSA J. 2025;23(7):e9478. https://doi.org/10.2903/j.efsa.2025.9478.
-
US Department of Health, Human Services Federal Panel on Community Water Fluoridation. U.S. Public health service recommendation for fluoride concentration in drinking water for the prevention of dental caries. Public Health Rep. 2015;130(4):318–31. https://doi.org/10.1177/003335491513000408.
-
Whitford GM. Intake and metabolism of fluoride. Adv Dent Res. 1994;8(1):5–14. https://doi.org/10.1177/08959374940080011001.
-
Vinceti SR, Veneri F, Filippini T. Water fluoridation between public health and public law: an assessment of regulations across countries and their preventive medicine implications. Ann Ig. 2024;36(3):261–9. https://doi.org/10.7416/ai.2024.2594.
-
McLaren L, Singhal S. Does cessation of community water fluoridation lead to an increase in tooth decay? A systematic review of published studies. J Epidemiol Community Health. 2016;70(9):934–40. https://doi.org/10.1136/jech-2015-206502.
-
Iheozor-Ejiofor Z, Walsh T, Lewis SR, Riley P, Boyers D, Clarkson JE, Worthington HV, Glenny AM, O’Malley L. Water fluoridation for the prevention of dental caries. Cochrane Database Syst Rev. 2024;10(10):CD010856. https://doi.org/10.1002/14651858.CD010856.pub3.
-
Iamandii I, De Pasquale L, Giannone ME, Veneri F, Generali L, Consolo U, et al. Does fluoride exposure affect thyroid function? A systematic review and dose-response meta-analysis. Environ Res. 2024;242:117759. https://doi.org/10.1016/j.envres.2023.117759.
-
National Toxicology Program. NTP monograph on the state of the science concerning fluoride exposure and neurodevelopment and cognition: a systematic review. NTP Monogr. 2024;810.22427/NTP-MGRAPH-8.
-
Taylor KW, Eftim SE, Sibrizzi CA, Blain RB, Magnuson K, Hartman PA, Rooney AA, Bucher JR. Fluoride exposure and children’s IQ scores: a systematic review and meta-analysis. JAMA Pediatr. 2025;179(3):282–92. https://doi.org/10.1001/jamapediatrics.2024.5542.
-
Veneri F, Iamandii I, Vinceti M, Birnbaum LS, Generali L, Consolo U, et al. Fluoride exposure and skeletal fluorosis: a systematic review and dose-response meta-analysis. Curr Environ Health Rep. 2023;10(4):417–41. https://doi.org/10.1007/s40572-023-00412-9.
-
Veneri F, Vinceti M, Generali L, Giannone ME, Mazzoleni E, Birnbaum LS, et al. Fluoride exposure and cognitive neurodevelopment: systematic review and dose-response meta-analysis. Environ Res. 2023;221:115239. https://doi.org/10.1016/j.envres.2023.115239.
-
Grandjean P, Meddis A, Nielsen F, Beck IH, Bilenberg N, Goodman CV, Hu H, Till C, Budtz-Jorgensen E. Dose dependence of prenatal fluoride exposure associations with cognitive performance at school age in three prospective studies. Eur J Public Health. 2024;34(1):143–9. https://doi.org/10.1093/eurpub/ckad170.
-
Helte E, Vargas CD, Kippler M, Wolk A, Michaëlsson K, Åkesson A. Fluoride in drinking water, diet, and urine in relation to bone mineral density and fracture incidence in postmenopausal women. Environ Health Perspect. 2021;129(4):47005. https://doi.org/10.1289/EHP7404.
-
Taher MK, Momoli F, Go J, Hagiwara S, Ramoju S, Hu X, Jensen N, Terrell R, Hemmerich A, Krewski D. Systematic review of epidemiological and toxicological evidence on health effects of fluoride in drinking water. Crit Rev Toxicol. 2024;54(1):2–34. https://doi.org/10.1080/10408444.2023.2295338.
-
Choi SE, Simon L. Projected outcomes of removing fluoride from US public water systems. JAMA Health Forum. 2025;6(5):e251166. https://doi.org/10.1001/jamahealthforum.2025.1166.
-
Lanphear BP, Den Besten P, Till C. Time to reassess systemic fluoride exposure, again. JAMA Pediatr. 2025;179(3):234–6. https://doi.org/10.1001/jamapediatrics.2024.5549.
-
Levy SM. Caution needed in interpreting the evidence base on fluoride and IQ. JAMA Pediatr. 2025;179(3):231–4. https://doi.org/10.1001/jamapediatrics.2024.5539.
-
Moore D, Glenny AM. Fluoride and children’s IQ: evidence of causation lacking. Evid Based Dent. 2024;25(2):95–7. https://doi.org/10.1038/s41432-024-01022-6.
-
Stokstad E. Does fluoride in drinking water risk IQ loss? Science. 2024;383(6683):579. https://doi.org/10.1126/science.ado5313.
-
Grandjean P. Developmental fluoride neurotoxicity: an updated review. Environ Health. 2019;18(1):110. https://doi.org/10.1186/s12940-019-0551-x.
-
Page MJ, McKenzie JE, Bossuyt PM, Boutron I, Hoffmann TC, Mulrow CD, Shamseer L, Tetzlaff JM, Akl EA, Brennan SE, et al. The PRISMA 2020 statement: an updated guideline for reporting systematic reviews. BMJ. 2021;372:n71. https://doi.org/10.1136/bmj.n71.
-
Morgan RL, Whaley P, Thayer KA, Schunemann HJ. Identifying the PECO: A framework for formulating good questions to explore the association of environmental and other exposures with health outcomes. Environ Int. 2018;121(Pt 1):1027–31. https://doi.org/10.1016/j.envint.2018.07.015.
-
EUnetHTA. Process of information retrieval for systematic reviews and health technology assessments on clinical effectiveness. Methodological Guidelines. In., 2 edn. Diemen, The Netherlands: EUnetHTA; 2019.
-
Higgins JPT, Lopez-Lopez JA, Becker BJ, Davies SR, Dawson S, Grimshaw JM, et al. Synthesising quantitative evidence in systematic reviews of complex health interventions. BMJ Glob Health. 2019;4(Suppl 1):e000858. https://doi.org/10.1136/bmjgh-2018-000858.
-
Morgan RL, Thayer KA, Santesso N, Holloway AC, Blain R, Eftim SE, Goldstone AE, Ross P, Ansari M, Akl EA, et al. A risk of bias instrument for non-randomized studies of exposures: a users’ guide to its application in the context of GRADE. Environ Int. 2019;122:168–84. https://doi.org/10.1016/j.envint.2018.11.004.
-
Orsini N. Weighted mixed-effects dose–response models for tables of correlated contrasts. Stata J. 2021;21(2):320–47. https://doi.org/10.1177/1536867×211025798.
-
Crippa A, Discacciati A, Bottai M, Spiegelman D, Orsini N. One-stage dose-response meta-analysis for aggregated data. Stat Methods Med Res. 2019;28(5):1579–96. https://doi.org/10.1177/0962280218773122.
-
Di Federico S, Filippini T, Whelton PK, Cecchini M, Iamandii I, Boriani G, Vinceti M. Alcohol intake and blood pressure levels: a dose-response meta-analysis of nonexperimental cohort studies. Hypertension. 2023;80(10):1961–9. https://doi.org/10.1161/HYPERTENSIONAHA.123.21224.
-
Filippini T, Hatch EE, Rothman KJ, Heck JE, Park AS, Crippa A, Orsini N, Vinceti M. Association between outdoor air pollution and childhood leukemia: a systematic review and dose-response meta-analysis. Environ Health Perspect. 2019;127(4):46002. https://doi.org/10.1289/EHP4381.
-
Vinceti M, Filippini T, Wise LA, Rothman KJ. A systematic review and dose-response meta-analysis of exposure to environmental selenium and the risk of type 2 diabetes in nonexperimental studies. Environ Res. 2021;197:111210. https://doi.org/10.1016/j.envres.2021.111210.
-
Verzelloni P, Urbano T, Wise LA, Vinceti M, Filippini T. Cadmium exposure and cardiovascular disease risk: a systematic review and dose-response meta-analysis. Environ Pollut. 2024;345:123462. https://doi.org/10.1016/j.envpol.2024.123462.
-
Filippini T, Wise LA, Vinceti M. Cadmium exposure and risk of diabetes and prediabetes: a systematic review and dose-response meta-analysis. Environ Int. 2022;158:106920. https://doi.org/10.1016/j.envint.2021.106920.
-
Crippa A, Khudyakov P, Wang M, Orsini N, Spiegelman D. A new measure of between-studies heterogeneity in meta-analysis. Stat Med. 2016;35(21):3661–75. https://doi.org/10.1002/sim.6980.
-
Murad MH, Verbeek J, Schwingshackl L, Filippini T, Vinceti M, Akl EA, et al. Grade guidance 38: updated guidance for rating up certainty of evidence due to a dose-response gradient. J Clin Epidemiol. 2023;164:45–53. https://doi.org/10.1016/j.jclinepi.2023.09.011.
-
InterLace Study Team. Variations in reproductive events across life: a pooled analysis of data from 505 147 women across 10 countries. Hum Reprod. 2019;34(5):881–93. https://doi.org/10.1093/humrep/dez015.
-
McClure FJ. Fluoride domestic waters and systemic effects: I. relation to bone-fracture experience, height, and weight of high school boys and young selectees of the armed forces of the united States. Public Health Rep (1896). 1944;59(48):1543–58. https://doi.org/10.2307/4585109.
-
Alhava EM, Olkkonen H, Kauranen P, Kari T. The effect of drinking water fluoridation on the fluoride content, strength and mineral density of human bone. Acta Orthop Scand. 1980;51(3):413–20. https://doi.org/10.3109/17453678008990817.
-
Arnold CM, Bailey DA, Faulkner RA, McKay HA, McCulloch RG. The effect of water fluoridation on the bone mineral density of young women. Can J Public Health. 1997;88(6):388–91. https://doi.org/10.1007/bf03403912.
-
Chen S, Li B, Lin S, Huang Y, Zhao X, Zhang M, et al. Change of urinary fluoride and bone metabolism indicators in the endemic fluorosis areas of Southern China after supplying low fluoride public water. BMC Public Health. 2013;13:156. https://doi.org/10.1186/1471-2458-13-156.
-
Czarnowski W, Krechniak J, Urba?ska B, Stolarska K, Taraszewska-Czarnowska M, Muraszko-Klaudel A. The impact of water-borne fluoride on bone density. Fluoride. 1999;32(2):91–5.
-
Godebo TR, Jeuland M, Tekle-Haimanot R, Shankar A, Alemayehu B, Assefa G, et al. Bone quality in fluoride-exposed populations: a novel application of the ultrasonic method. Bone Rep. 2020;12:100235. https://doi.org/10.1016/j.bonr.2019.100235.
-
Lan CF, Lin IF, Wang SJ. Fluoride in drinking water and the bone mineral density of women in Taiwan. Int J Epidemiol. 1995;24(6):1182–7. https://doi.org/10.1093/ije/24.6.1182.
-
Lotborn M, Bratteby LE, Samuelson G, Ljunghall S, Sjostrom L. Whole-body bone mineral measurements in 15-year-old Swedish adolescents. Osteoporos Int. 1999;9(2):106–14. https://doi.org/10.1007/s001980050122.
-
Phipps KR, Burt BA. Water-borne fluoride and cortical bone mass: a comparison of two communities. J Dent Res. 1990;69(6):1256–60. https://doi.org/10.1177/00220345900690060601.
-
Phipps KR, Orwoll ES, Bevan L. The association between water-borne fluoride and bone mineral density in older adults. J Dent Res. 1998;77(9):1739–48. https://doi.org/10.1177/00220345980770091001.
-
Arnala I, Alhava EM, Kivivuori R, Kauranen P. Hip fracture incidence not affected by fluoridation. Osteofluorosis studied in Finland. Acta Orthop Scand. 1986;57(4):344–8. https://doi.org/10.3109/17453678608994408.
-
Cooper C, Wickham C, Lacey RF, Barker DJ. Water fluoride concentration and fracture of the proximal femur. J Epidemiol Community Health. 1990;44(1):17–9. https://doi.org/10.1136/jech.44.1.17.
-
Danielson C, Lyon JL, Egger M, Goodenough GK. Hip fractures and fluoridation in utah’s elderly population. JAMA. 1992;268(6):746–8. https://doi.org/10.1001/jama.1992.03490060078027.
-
Fabiani L, Leoni V, Vitali M. Bone-fracture incidence rate in two Italian regions with different fluoride concentration levels in drinking water. J Trace Elem Med Biol. 1999;13(4):232–7. https://doi.org/10.1016/S0946-672X(99)80041-8.
-
Feskanich D, Owusu W, Hunter DJ, Willett W, Ascherio A, Siegelman D, Morris S, Spate VL, Colditz G, Feskanich D, et al. Use of toenail fluoride levels as an indicator for the risk of hip and forearm fractures in women. Epidemiology. 1998;9(4):412–6. https://doi.org/10.1097/00001648-199807000-00011.
-
Goggin JE, Haddon W Jr., Hambly GS, Hovel RJ. Incidence of femoral fractures in postmenopausal women. Before and after water fluoridation. Public Health Rep (1896). 1965;80(11):1005–12. https://doi.org/10.2307/4592594.
-
Hillier S, Cooper C, Kellingray S, Russell G, Hughes H, Coggon D. Fluoride in drinking water and risk of hip fracture in the UK: a case-control study. Lancet. 2000;355(9200):265–9. https://doi.org/10.1016/S0140-6736(99)07161-5.
-
Jacobsen SJ, Goldberg J, Cooper C, Lockwood SA. The association between water fluoridation and hip fracture among white women and men aged 65 years and older. A National Ecologic study. Ann Epidemiol. 1992;2(5):617–26. https://doi.org/10.1016/1047-2797(92)90006-c.
-
Karagas MR, Baron JA, Barrett JA, Jacobsen SJ. Patterns of fracture among the united States elderly: geographic and fluoride effects. Ann Epidemiol. 1996;6(3):209–16. https://doi.org/10.1016/1047-2797(96)00006-3.
-
Korns RF. Relationship of water fluoridation to bone density in two N.Y. towns. Public Health Rep (1896). 1969;84(9):815–25. https://doi.org/10.2307/4593687.
-
Kurttio P, Gustavsson N, Vartiainen T, Pekkanen J. Exposure to natural fluoride in well water and hip fracture: a cohort analysis in Finland. Am J Epidemiol. 1999;150(8):817–24. https://doi.org/10.1093/oxfordjournals.aje.a010086.
-
Lee WS, Kim JH, Han B, Lee GC, Jung HR, Shin YJ, Ha EK, Lee E, Lee S, Han MY. Association of fluoride exposure with disease burden and neurodevelopment outcomes in children in South Korea. World J Pediatr. 2024;20(10):1029–42. https://doi.org/10.1007/s12519-024-00820-3.
-
Li Y, Liang C, Slemenda CW, Ji R, Sun S, Cao J, et al. Effect of long-term exposure to fluoride in drinking water on risks of bone fractures. J Bone Miner Res. 2001;16(5):932–9. https://doi.org/10.1359/jbmr.2001.16.5.932.
-
Lindsay SE, Smith S, Yang S, Yoo J. Community water fluoridation and rate of pediatric fractures. JAAOS: Global Research and Reviews. 2023;7(10):e22.00221.
-
Näsman P, Ekstrand J, Granath F, Ekbom A, Fored CM. Estimated drinking water fluoride exposure and risk of hip fracture: a cohort study. J Dent Res. 2013;92(11):1029–34. https://doi.org/10.1177/0022034513506443.
-
Simonen O, Laitinen O. Does fluoridation of drinking-water prevent bone fragility and osteoporosis? Lancet. 1985;2(8452):432–4. https://doi.org/10.1016/s0140-6736(85)92748-5.
-
Suarez-Almazor ME, Flowerdew G, Saunders LD, Soskolne CL, Russell AS. The fluoridation of drinking water and hip fracture hospitalization rates in two Canadian communities. Am J Public Health. 1993;83(5):689–93. https://doi.org/10.2105/ajph.83.5.689.
-
Young N, Newton J, Morris J, Morris J, Langford J, Iloya J, et al. Community water fluoridation and health outcomes in England: a cross-sectional study. Community Dent Oral Epidemiol. 2015;43(6):550–9. https://doi.org/10.1111/cdoe.12180.
-
Cauley JA, Murphy PA, Riley TJ, Buhari AM. Effects of fluoridated drinking water on bone mass and fractures: the study of osteoporotic fractures. J Bone Miner Res. 1995;10(7):1076–86. https://doi.org/10.1002/jbmr.5650100712.
-
Kröger H, Alhava E, Honkanen R, Tuppurainen M, Saarikoski S. The effect of fluoridated drinking water on axial bone mineral density–a population-based study. Bone Min. 1994;27(1):33–41. https://doi.org/10.1016/s0169-6009(08)80184-5.
-
Lehmann R, Wapniarz M, Hofmann B, Pieper B, Haubitz I, Allolio B. Drinking water fluoridation: bone mineral density and hip fracture incidence. Bone. 1998;22(3):273–8. https://doi.org/10.1016/s8756-3282(97)00273-1.
-
Levy S, Warren J, Phipps K, Letuchy E, Broffitt B, Eichenberger-Gilmore J, et al. Effects of life-long fluoride intake on bone measures of adolescents a prospective cohort study. J Dent Res. 2014;93(4):353–9. https://doi.org/10.1177/0022034514520708.
-
Phipps KR, Orwoll ES, Mason JD, Cauley JA. Community water fluoridation, bone mineral density, and fractures: prospective study of effects in older women. BMJ. 2000;321(7265):860–4. https://doi.org/10.1136/bmj.321.7265.860.
-
Sowers MF, Clark MK, Jannausch ML, Wallace RB. A prospective study of bone mineral content and fracture in communities with differential fluoride exposure. Am J Epidemiol. 1991;133(7):649–60. https://doi.org/10.1093/oxfordjournals.aje.a115940.
-
Sowers M, Whitford GM, Clark MK, Jannausch ML. Elevated serum fluoride concentrations in women are not related to fractures and bone mineral density. J Nutr. 2005;135(9):2247–52. https://doi.org/10.1093/jn/135.9.2247.
-
Kong H, He Z, Li H, Xing D, Lin J. The association between fluoride and bone mineral density in US children and adolescents: a pilot study. Nutrients. 2024;16(17):2948. https://doi.org/10.3390/nu16172948.
-
Lehmann R, Allolio B. [Osteoporosis therapy. A pluralistic approach]. Internist (Berl). 1998;39(12):1253–63. https://doi.org/10.1007/s001080050298.
-
Chen P, Miller PD, Delmas PD, Misurski DA, Krege JH. Change in lumbar spine BMD and vertebral fracture risk reduction in teriparatide-treated postmenopausal women with osteoporosis. J Bone Miner Res. 2006;21(11):1785–90. https://doi.org/10.1359/jbmr.060802.
-
Levin VA, Jiang X, Kagan R. Estrogen therapy for osteoporosis in the modern era. Osteoporos Int. 2018;29(5):1049–55. https://doi.org/10.1007/s00198-018-4414-z.
-
Allolio B, Lehmann R. Drinking water fluoridation and bone. Exp Clin Endocrinol Diabetes. 1999;107(1):12–20. https://doi.org/10.1055/s-0029-1212067.
-
Kleerekoper M. Fluoride and the skeleton. Crit Rev Clin Lab Sci. 1996;33(2):139–61. https://doi.org/10.3109/10408369609083059.
-
Jones G, Riley M, Couper D, Dwyer T. Water fluoridation, bone mass and fracture: a quantitative overview of the literature. Aust N Z J Public Health. 1999;23(1):34–40. https://doi.org/10.1111/j.1467-842x.1999.tb01202.x.
-
Raheb J. Water fluoridation, bone density and hip fractures: a review of recent literature. Community Dent Oral Epidemiol. 1995;23(5):309–16. https://doi.org/10.1111/j.1600-0528.1995.tb00254.x.
-
Yin XH, Huang GL, Lin DR, Wan CC, Wang YD, Song JK, Xu P. Exposure to fluoride in drinking water and hip fracture risk: a meta-analysis of observational studies. PLoS ONE. 2015;10(5):e0126488. https://doi.org/10.1371/journal.pone.0126488.
-
Community water fluoridation [https://www.cdc.gov/fluoridation/index.html]
-
Scientific opinion on fluoride in food and drinking water. Art 29 Scientific Opinion EFSA-Q-2021-00358 [https://open.efsa.europa.eu/questions/EFSA-Q-2021-00358]
-
Gauthier R, Langer M, Follet H, Olivier C, Gouttenoire PJ, Helfen L, et al. 3D micro structural analysis of human cortical bone in paired femoral diaphysis, femoral neck and radial diaphysis. J Struct Biol. 2018;204(2):182–90. https://doi.org/10.1016/j.jsb.2018.08.006.
-
Toth E, Banefelt J, Akesson K, Spangeus A, Ortsater G, Libanati C. History of previous fracture and imminent fracture risk in Swedish women aged 55 to 90 years presenting with a fragility fracture. J Bone Miner Res. 2020;35(5):861–8. https://doi.org/10.1002/jbmr.3953.
-
Wade SW, Strader C, Fitzpatrick LA, Anthony MS. Sex- and age-specific incidence of non-traumatic fractures in selected industrialized countries. Arch Osteoporos. 2012;7:219–27. https://doi.org/10.1007/s11657-012-0100-5.
-
de Villiers TJ. Bone health and menopause: osteoporosis prevention and treatment. Best Pract Res Clin Endocrinol Metab. 2024;38(1):101782. https://doi.org/10.1016/j.beem.2023.101782.
-
Yoo JE, Shin DW, Han K, Kim D, Yoon JW, Lee DY. Association of female reproductive factors with incidence of fracture among postmenopausal women in Korea. JAMA Netw Open. 2021;4(1):e2030405. https://doi.org/10.1001/jamanetworkopen.2020.30405.
-
Kang HY, Yang KH, Kim YN, Moon SH, Choi WJ, Kang DR, et al. Incidence and mortality of hip fracture among the elderly population in South Korea: a population-based study using the National health insurance claims data. BMC Public Health. 2010;10:230. https://doi.org/10.1186/1471-2458-10-230.
-
Streicher C, Heyny A, Andrukhova O, Haigl B, Slavic S, Schuler C, et al. Estrogen regulates bone turnover by targeting RANKL expression in bone lining cells. Sci Rep. 2017;7(1):6460. https://doi.org/10.1038/s41598-017-06614-0.
-
Khosla S, Monroe DG. Regulation of bone metabolism by sex steroids. Cold Spring Harb Perspect Med. 2018;8(1):a031211. https://doi.org/10.1101/cshperspect.a031211.
-
US EPA. Risk Evaluations for Existing Chemicals under TSCA. In. Washington, D.C.: US Environmental Protection Agency. 2025. https://www.epa.gov/assessing-and-managing-chemicals-under-tsca/risk-evaluations-existing-chemicals-under-tsca (Accessed August 29, 2025).
-
Bai R, Huang Y, Wang F, Guo J. Associations of fluoride exposure with sex steroid hormones among U.S. children and adolescents, NHANES 2013–2016. Environ Pollut. 2020;260:114003. https://doi.org/10.1016/j.envpol.2020.114003.
-
Skorka-Majewicz M, Goschorska M, Zwierello W, Baranowska-Bosiacka I, Styburski D, Kapczuk P, Gutowska I. Effect of fluoride on endocrine tissues and their secretory functions — review. Chemosphere. 2020;260:127565. https://doi.org/10.1016/j.chemosphere.2020.127565.
-
Zhao MX, Zhou GY, Zhu JY, Gong B, Hou JX, Zhou T, Duan LJ, Ding Z, Cui LX, Ba Y. Fluoride exposure, follicle stimulating hormone receptor gene polymorphism and hypothalamus-pituitary-ovarian axis hormones in Chinese women. Biomed Environ Sci. 2015;28(9):696–700. https://doi.org/10.3967/bes2015.099.
-
Griebel-Thompson AK, Sands S, Chollet-Hinton L, Christifano D, Sullivan DK, Hull H, et al. Maternal urinary fluoride levels of a large pregnancy cohort in the United States: findings from the ADORE study. Environ Health Perspect. 2025;133(3–4):47001. https://doi.org/10.1289/EHP14711.
-
Khan D, Franks S, Wang Z, Miles A, Hu H, Malin AJ. Urinary fluoride levels among youth in the National health and nutrition examination survey (NHANES) 2015–2016: potential differences according to race. Nutrients. 2025;17(2):309. https://doi.org/10.3390/nu17020309.
-
US EPA. Fluoride: exposure and relative source contribution analysis In. Edited by Water HaECDOo. Washington, D.C.: U.S. Environmental Protection Agency. 2010. https://www.epa.gov/sites/default/files/2019-03/documents/fluoride-exposure-relative-report.pdf (Accessed August 29, 2025).
-
Green R, Till C, Cantoral A, Lanphear B, Martinez-Mier EA, Ayotte P, et al. Associations between urinary, dietary, and water fluoride concentrations among children in Mexico and Canada. Toxics. 2020;8(4):110. https://doi.org/10.3390/toxics8040110.
-
Aylward LL, Hays SM, Vezina A, Deveau M, St-Amand A, Nong A. Biomonitoring equivalents for interpretation of urinary fluoride. Regul Toxicol Pharmacol. 2015;72(1):158–67. https://doi.org/10.1016/j.yrtph.2015.04.005.
-
Fonseca H, Moreira-Goncalves D, Coriolano HJ, Duarte JA. Bone quality: the determinants of bone strength and fragility. Sports Med. 2014;44(1):37–53. https://doi.org/10.1007/s40279-013-0100-7.
-
Adami S, Gatti D, Braga V, Bianchini D, Rossini M. Site-specific effects of strength training on bone structure and geometry of ultradistal radius in postmenopausal women. J Bone Miner Res. 1999;14(1):120–4. https://doi.org/10.1359/jbmr.1999.14.1.120.
-
Burr DB. The contribution of the organic matrix to bone’s material properties. Bone. 2002;31(1):8–11. https://doi.org/10.1016/s8756-3282(02)00815-3.
-
Donnelly E. Methods for assessing bone quality: a review. Clin Orthop Relat Res. 2011;469(8):2128–38. https://doi.org/10.1007/s11999-010-1702-0.
-
Hernandez CJ, Gupta A, Keaveny TM. A biomechanical analysis of the effects of resorption cavities on cancellous bone strength. J Bone Miner Res. 2006;21(8):1248–55. https://doi.org/10.1359/jbmr.060514.
-
Binkley N, Blank RD, Leslie WD, Lewiecki EM, Eisman JA, Bilezikian JP. Osteoporosis in crisis: it’s time to focus on fracture. J Bone Miner Res. 2017;32(7):1391–4. https://doi.org/10.1002/jbmr.3182.
-
Nicole W. Denser but not stronger? Fluoride-induced bone growth and increased risk of hip fractures. Environ Health Perspect. 2021;129(7):74001. https://doi.org/10.1289/ehp9533.
Acknowledgements
Not applicable.
Funding
None.
Ethics declarations
Competing interests
The authors declare no competing interests.
Ethics approval and consent to participate
Not applicable.
Consent for publication
Not applicable.
Supplementary Information